# Consolidation incentives in Orbit SSF (draft)
*What follows is a rough draft of how we can design consolidation incentives in Orbit SSF, published to facilitate discussion during Devcon.*
## 1. Introduction
A key proposition of [Orbit SSF](https://ethresear.ch/t/orbit-ssf-solo-staking-friendly-validator-set-management-for-ssf/19928) is that validators rotate based on their size, such that those with larger balances are active more frequently. Active validators can be slashed, so large validators will therefore assume greater risk than small validators. Setting aside mass slashing events, a staking pool might prefer to run smaller validators so that a faulty setup can be caught early and affect only a small fracion of its total stake. For these reasons, Orbit SSF should provide [individual consolidation incentives](https://ethresear.ch/t/orbit-ssf-solo-staking-friendly-validator-set-management-for-ssf/19928#individual-consolidation-incentives-12). These can be combined with collective consolidation incentives that reward everyone upon consolidation.
As stipulated in the [Vorbit SSF](https://ethresear.ch/t/vorbit-ssf-with-circular-and-spiral-finality-validator-selection-and-distribution/20464) post, it can be desirable to see activity rates and incentives change across the full range of validators sizes, from 32 ETH to 2048 ETH. However, it can be difficult to assess beforehand how to distribute incentives such that it does not favor certain validator sizes, leading validators to congregate there. Validators' [activity rates](https://ethresear.ch/t/vorbit-ssf-with-circular-and-spiral-finality-validator-selection-and-distribution/20464#p-50029-h-82-activity-rate-24) might also not be the same for the active chain and the finality gadget. This further complicates the analysis.
As noted in [Practical endgame on issuance policy](https://ethresear.ch/t/practical-endgame-on-issuance-policy/20747), it is perilious to let a validator's stipulated activity rate also apply to its probability to propose blocks. However, if proposal rights are distributed according to stake as they are today, then individual incentives must be relatively stronger at a low issuance than at a high issuance, to compensate for the relatively high MEV that a a validator can accrue while staking with a relatively lower risk.
This post presents how consolidation incentives can be designed to account for outlined requirements. A consolidation force $f_1$ is presented in Section 2, which determines the overall strength of the incentives, varying with consolidation level. Section 3 then explores the force distribution $f_2$ that defines how the yield differential is distributed across validator sizes.
<!--
We might end up paying too little
A problem of dividing up incentives by activity rates is that it precludes... it still
Wait. Assuming "neutral on issuance". In the case when there is all 2048 validators and one 32 ETH validator, then the 32-ETH validator will have the same in both scenarios, because the mechanism will not be able to push down the 32-ETH validator below 0. Well, assume then neutral with boundaries. So in this case it would go -a for the 32 and +0.0000001a for the 2048s in both policies. Assume not neutral. Then it can go 1-2a up to 1. In this case, it goes 1-2a for 32 and 1-a for 2048 in dynamic case and 1-2a up to 1 in activity rate case.
In the opposite case, the single 2048 validator's yield can balloon, so then
In the case where there is one 32-ETH validator, one 1024, and the rest 2048,
-->
## 2. Consolidation force $f_1$
What follows is a sketch of "consolidation forces" ($f_1$) that are to be applied to incentivize consolidation.
### 2.1 Validators under a Zipfian quantity of stakers
The strength of the consolidation forces can be scaled according to the Zipfianness of the staking set. The validator size $V$, assuming a pure Zipfian staking distribution with stakers consolidating all available stake, can be calculated in accordance with the equations of [Appendix A](https://ethresear.ch/t/vorbit-ssf-with-circular-and-spiral-finality-validator-selection-and-distribution/20464#p-50029-a1-quantity-of-stakers-under-a-pure-zipfian-distribution-28) in the post on Vorbit SSF. Given a specific $D$, the Zipfian staking set size is first computed as
$$
N_Z = e^{ W \left( \frac{D}{32} e^\gamma \right) - \gamma}.
$$
If the minimum validator balance is 32 ETH, the Zipfian validator set size under full consolidation becomes
$$
V_Z=\frac{N_Z}{64} \left(63+\ln(N_Z/64) + 2\gamma \right).
$$
Naturally, this equation must be adjusted accordingly if the minimum validator size is smaller. At any given $D$, Ethereum should offer consolidation incentives as long as the validator set size stays above $V_Z$.
### 2.2 Consolidation force shapes
Given a specific $V_Z$---or other definition of a desirable consolidation level---we can proceed to outline how the consolidation force should be derived. We focus here strictly on shape, not scale, which is instead the focus in Section 2.3. The simplest example is to decrease the consolidation force linearly with increasing consolidation, as outlined in Figure 1. In this specific example, the force reaches 0 at the halfway point between $V_Z$ and the theoretical minimum $V_{\text{min}}$. A linear consolidation force is particularly appealing for collective consolidation incentives, where the derivative of the curve is of greater importance (stakers are collectively incentivized to change the force, whereas its magnitude does not directly affect their willingness to consolidate).

**Figure 1.** Linear consolidation force $f_1$.
Another option is to apply a sigmoidal consolidation force as outlined in Figure 2. In this example, the force was specified to reach around 10\% at $V_Z$ and 50\% at $3V_Z$. The sigmoidal equation used was
$$
f_1(V) = \frac{1}{1 + \left( \dfrac{2V_Z}{V} \right)^3}.
$$
A sigmoidal consolidation force is more relevant to consider for individual incentives, where magnitude directly works as an incentive, and not the derivative of the curve. A question to consider is if $f_1$ should go to zero already at $V_Z$, or if it is reasonable to leave some small incentive in place throughout the range. The latter option seems perhaps more attractive since, presumably, some individual incentive still must be in place under equilibrium. In other words, setting the individual incentive to zero at $V_Z$ precludes this point from being reached if it is not otherwise a profitable option for staking service providers (SSPs). But the existence of any remaining collective consolidation incentives at $V_Z$ can then also factor in.
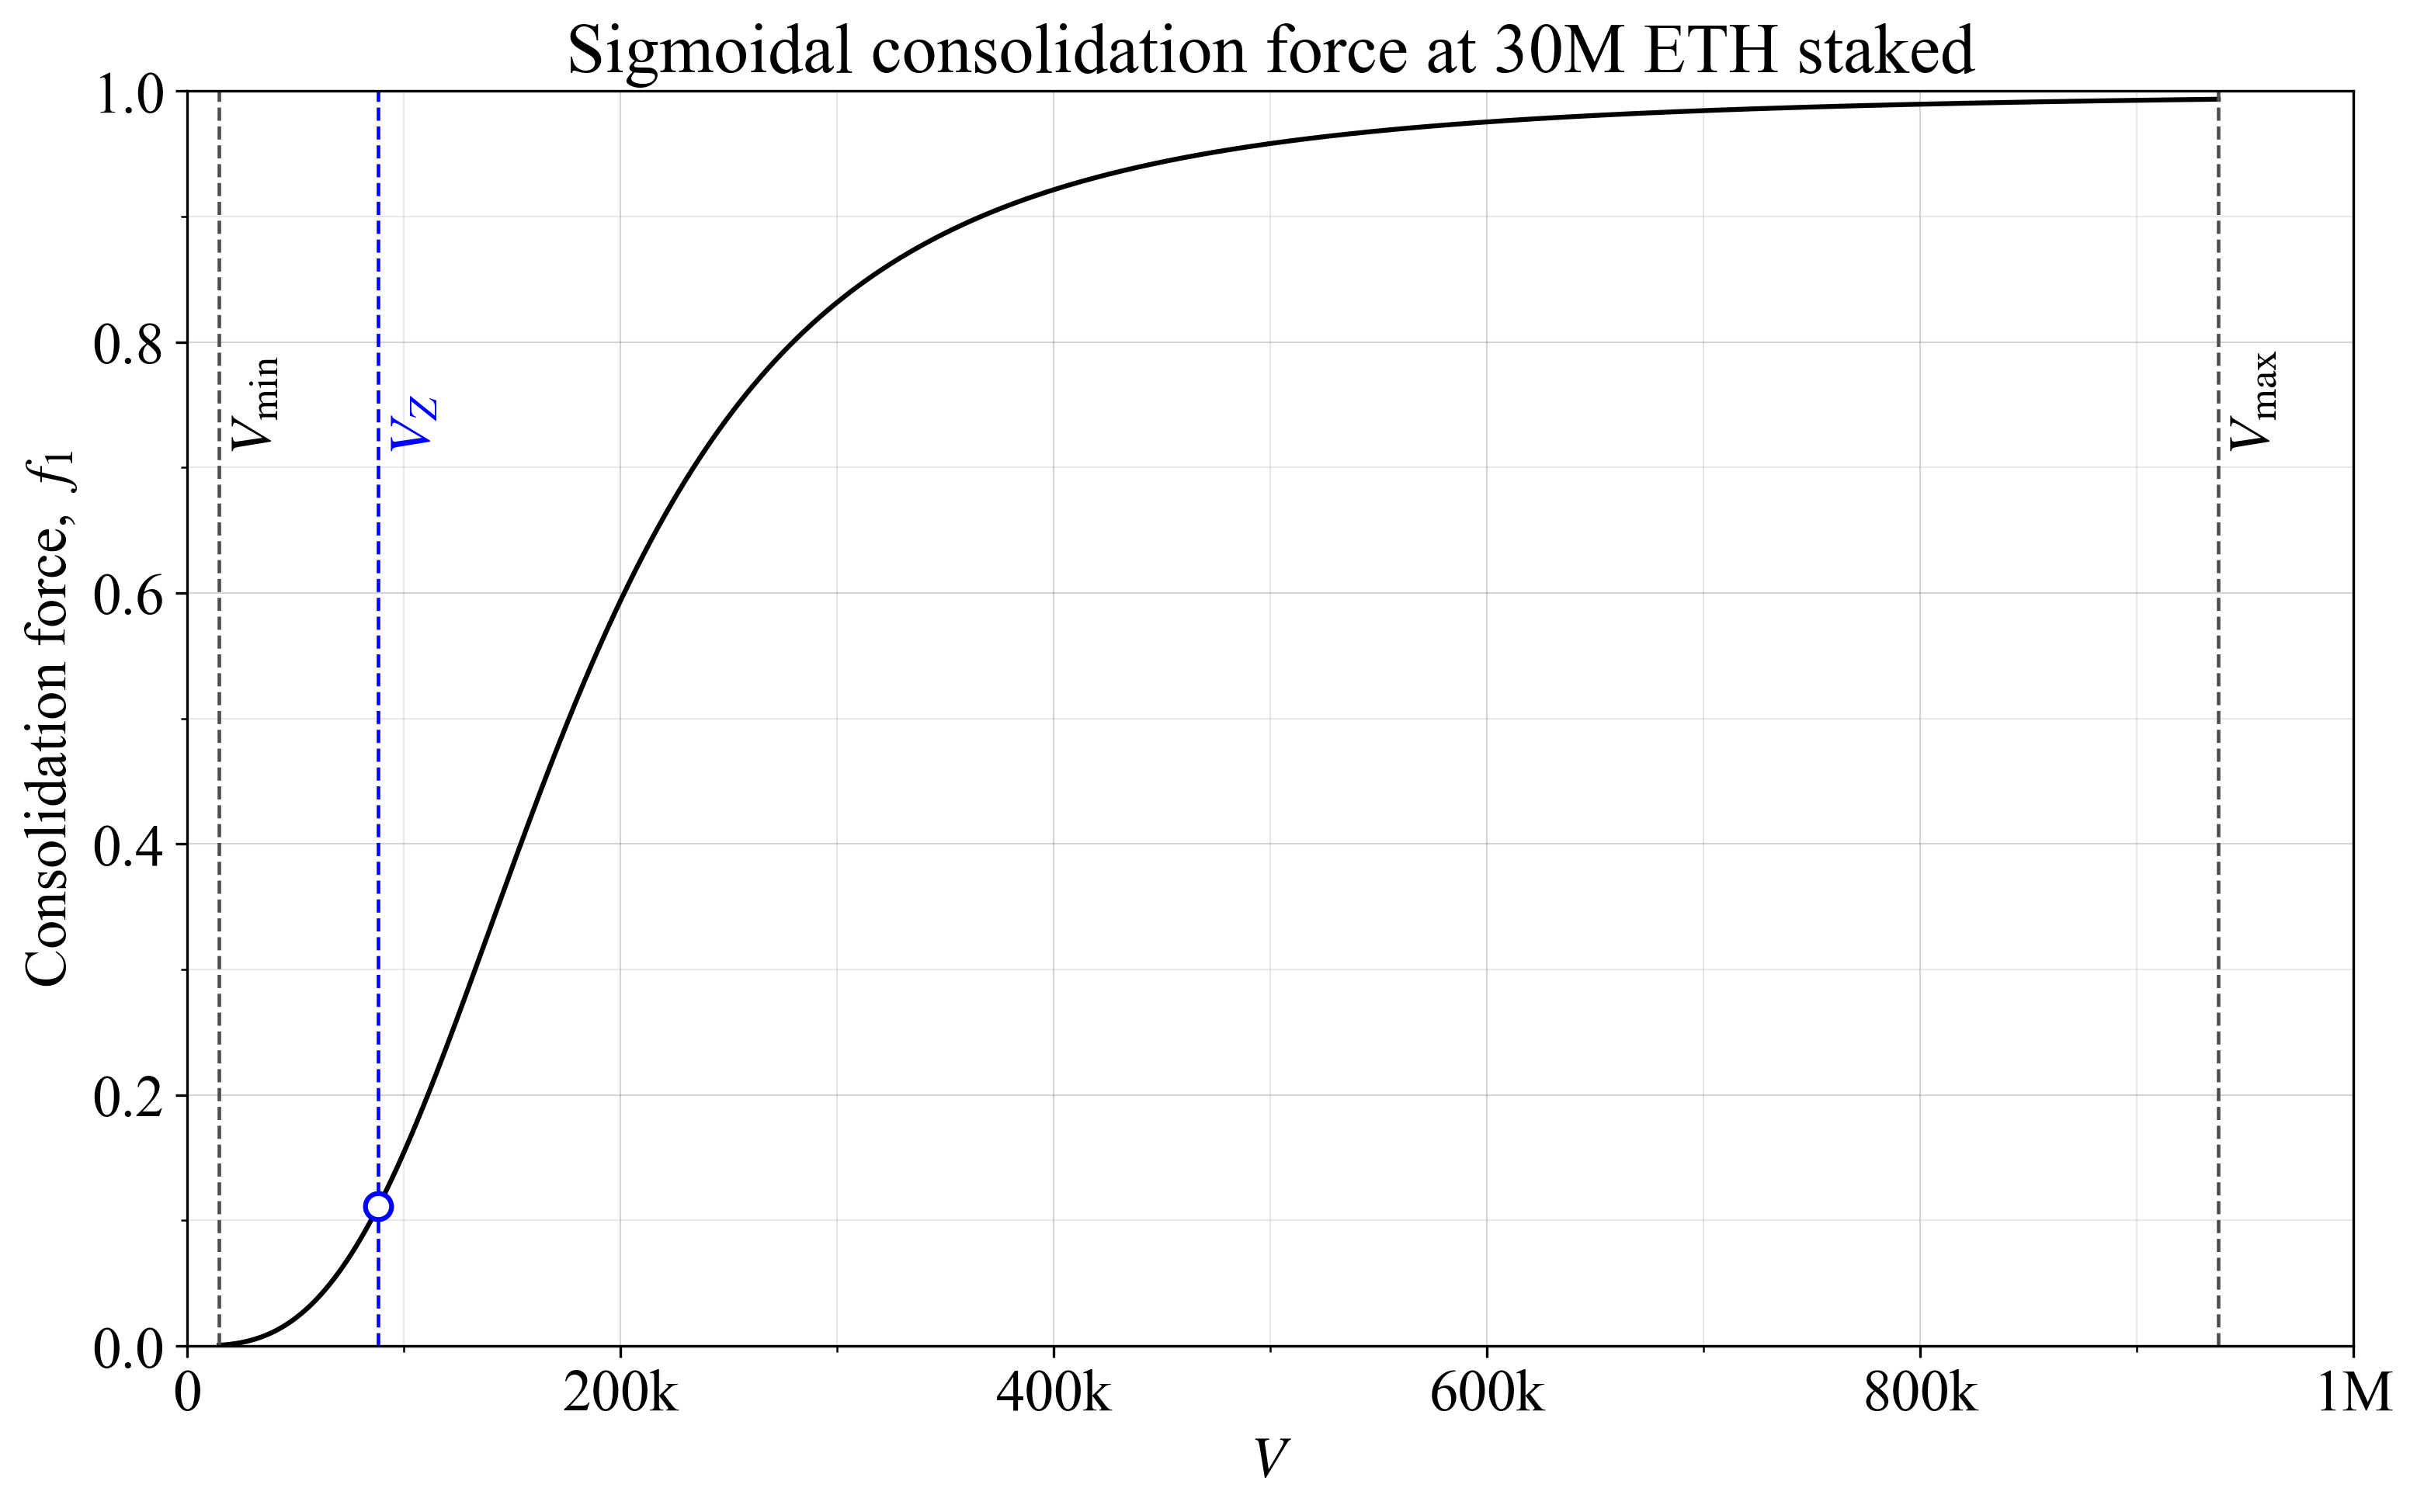
**Figure 2.** Sigmoidal consolidation force $f_1$.
Some compromise between the two options can also be considered, as shown in Figure 3 that weighs both previously outlined forces equally (with linear incentives this time applied across the full range). The derivative of the mixed force will not approach zero at higher numbers of validators, making it more relevant for collective incentives than the sigmoidal force.

**Figure 3.** Mixed consolidation force $f_1$.
The Orbit SSF proposal outlines another strategy for consolidation incentives, where issuance depends directly on active stake. This means that settings such as the maximum number of active validators $\hat{V}_a$ implicitly will have great influence on issuance. It might be possible to scale one strategy to be approximately equivalent to the other. With either strategy, it will be very important to work out all "edge cases" at low issuance, to ensure that incentives work as intended. It is further important to see to it that the "wrong actions" are never incentivized in any scenario (for example, to deconsolidate).
### 2.3 Consolidation force scale
Given arguments in the introduction and the post on the practical endgame, the size of the consolidation force will ultimately depend on the level of the MEV, and thus if we have achieved MEV burn at time of implementation. The consolidation force $f_1$ is to be scaled to incentivize consolidation, but there must be a balance to its strength. Strong individual incentives will be interpreted (rightfully so) as Ethereum treating smaller validators unfairly. Strong collective (and individual) incentives can lead to frictions among consensus participants, if the action of one party can have great influence on the yield of another party. For example, if the yield increases greatly when smaller or bigger validators leave, this incentivizes discouragement attacks. A benefit of combining collective and individual incentives is that the former gives validators higher rewards when there are many big validators, and the latter when there are many small. Thus the incentive to discouragement attack som particular validator size is somewhat neutralized.
Another thing to note is that if there are no individual incentives, and some SSP deconsolidates to lower risk while significantly reducing yield for everyone, this might lead to strong frictions. Particularly if there are no individual incentives in place.
Given how MEV influences the need for consolidation incentives at lower issuance, it is reasonable to rely on both a fixed and variable component. The force can thus be scaled as
$$
F_1 = f_1(ay_i+b).
$$
So for example, $a=0.2$ and $b=50\,000$ gives a maximum incentive (at $f_1=1$), of 20% of the issuance yield and 50k ETH. No exact specification for $a$ and $b$ can however be given at this point, because it will be influenced by whether MEV burn has been implemented, as well as the chosen reward curve.
### 2.4 Fixed or dynamic schedule
The baseline approach is to have a fixed schedule with no time component. The reason is the [same as when it comes to the reward curve](https://ethresear.ch/t/faq-ethereum-issuance-reduction/19675#why-not-dynamically-adjust-the-yield-with-a-mechanism-like-eip-1559-to-guarantee-some-fixed-target-participation-level-16), we are mainly interested in the effect in the long run. Should there be particular concerns around stakers temporarily altering the validator composition, for example in response to changes in MEV, it is of course possible to let the change to the long-run force be applied gradually when a shift occurs.
## 3. Force distribution $f_2$ for individual incentives
The force distribution $f_2$ determines how $F_1$ (derived from $f_1$) for individual incentives is distributed across the validator set. There are two main avenues:
* AID: incentives-differential based on activity rate (or any other applied notion of fairness),
* CID: cumulative incentives-differential that distributes incentives based on a sorted list of validator sizes.
### 3.1 AID
With AID, the protocol tries to price the distribution of risks assumed by validators of different sizes. Note that the task is not to determine the magnitude of the risks, which is dealt with by $f_1$, but how risks vary with validator size. A natural assumption could then be that risks vary with activity rate, which in turn varies with size in Orbit SSF. If the activity rate varies between validators attesting to the available chain and the finality gadget, an aggregated measure would need to be defined.
One potential benefit of relying on the activity rate is that cases with very lopsided distributions can be handled gracefully. Compare the scenario where there are many validators of sizes 32 and 2048 with the scenario where all validators have size 256. It seems desirable to have a higher yield differential in the first case than the second. With AID, the yield differential among validators of sizes around 256 ETH would be small, because there is no apparent risk differential motivating a larger yield differential. Another example is if there in the future are many validators of sizes around 32-35 ETH, for historical reasons. It might then be undesirable to differentiate these validators greatly in terms of individual incentives.
A downside of this approach is that if it fails to account for certain aspects when pricing risks, then validators might congregate to specific sizes that optimally take advantage of the mispricing. This leads to the idea of adapting incentives simply based on how validators are distributed, as will be outlined in Section 3.2.
### 3.2 CID
As previously discussed, any failure by AID to price some aspect of risk might lead validators to congregate to certain sizes. An alternative method is then to simply differentiate yields based on the sorted sizes of all validators, cumulatively according to total ETH accounted for at some specific size.
In the example of only 256-ETH validators from Section 3.1, the argument would be that this scenario would not happen unless there was some specific benefit derived from this size by stakers. Differentiating validators of size 255 and 257 might then not be so problematic.
It might be beneficial to apply $f_2$ in accordance with a discretized measure of a validator's active balance at the boundaries of 32 ETH and 2048 ETH, to avoid micromanagement of validator balances. For example, all validators between 32-33 ETH and between 2040-2048 ETH might receive the same $f_2$, computed as the mean of the highest and lowest $f_2$ tick values among validators within the range. Discretized ticks at other ranges can be considered for computational reasons, but would presumably only lead to *more* micromanagement of balances.
Figures 4-5 illustrate $f_2$ for a zipfian distribution, Figures 6-7 illustrate $f_2$ when validators skew larger, and Figures 8-9 illustrate $f_2$ with local peaks. Note that all figures were generated based on $100\,000$ validators. The aggregate ETH staked therefore varies greatly between different examples.
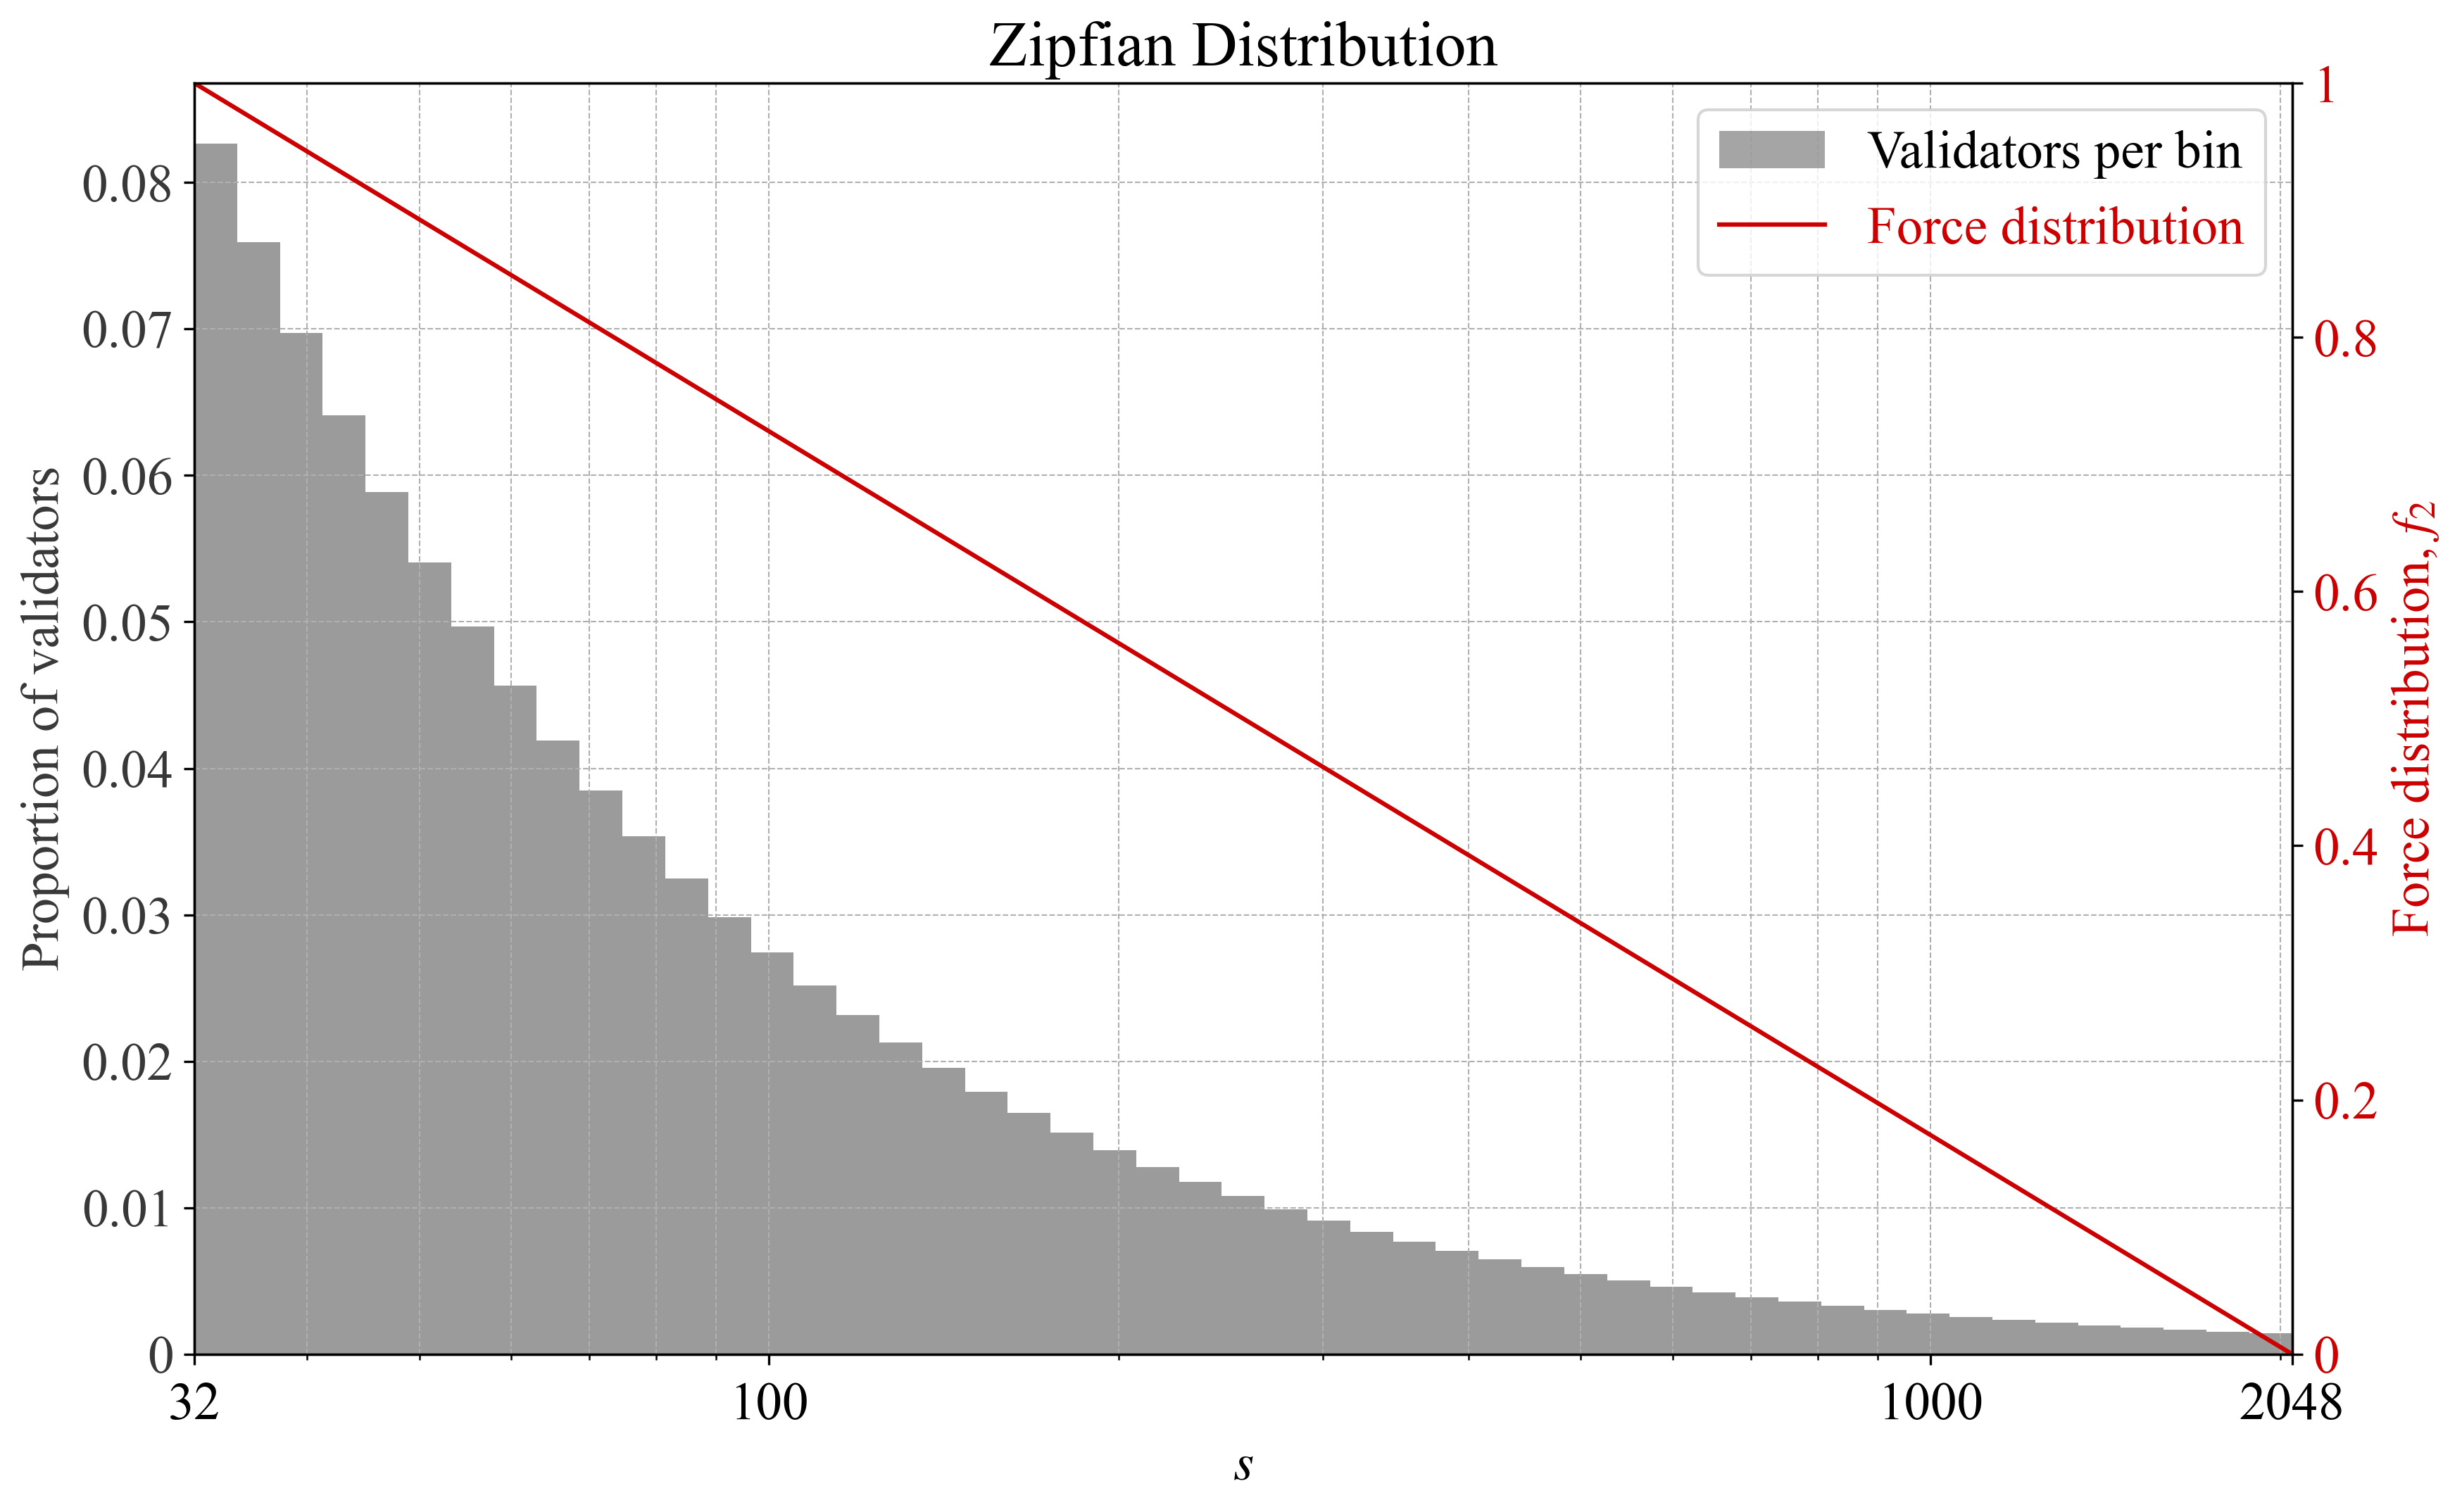
**Figure 4.** Force distribution $f_2$ under a Zipfian validator set plotted against number of validators per bin.

**Figure 5.** Force distribution $f_2$ under a Zipfian validator set plotted against total ETH per bin.
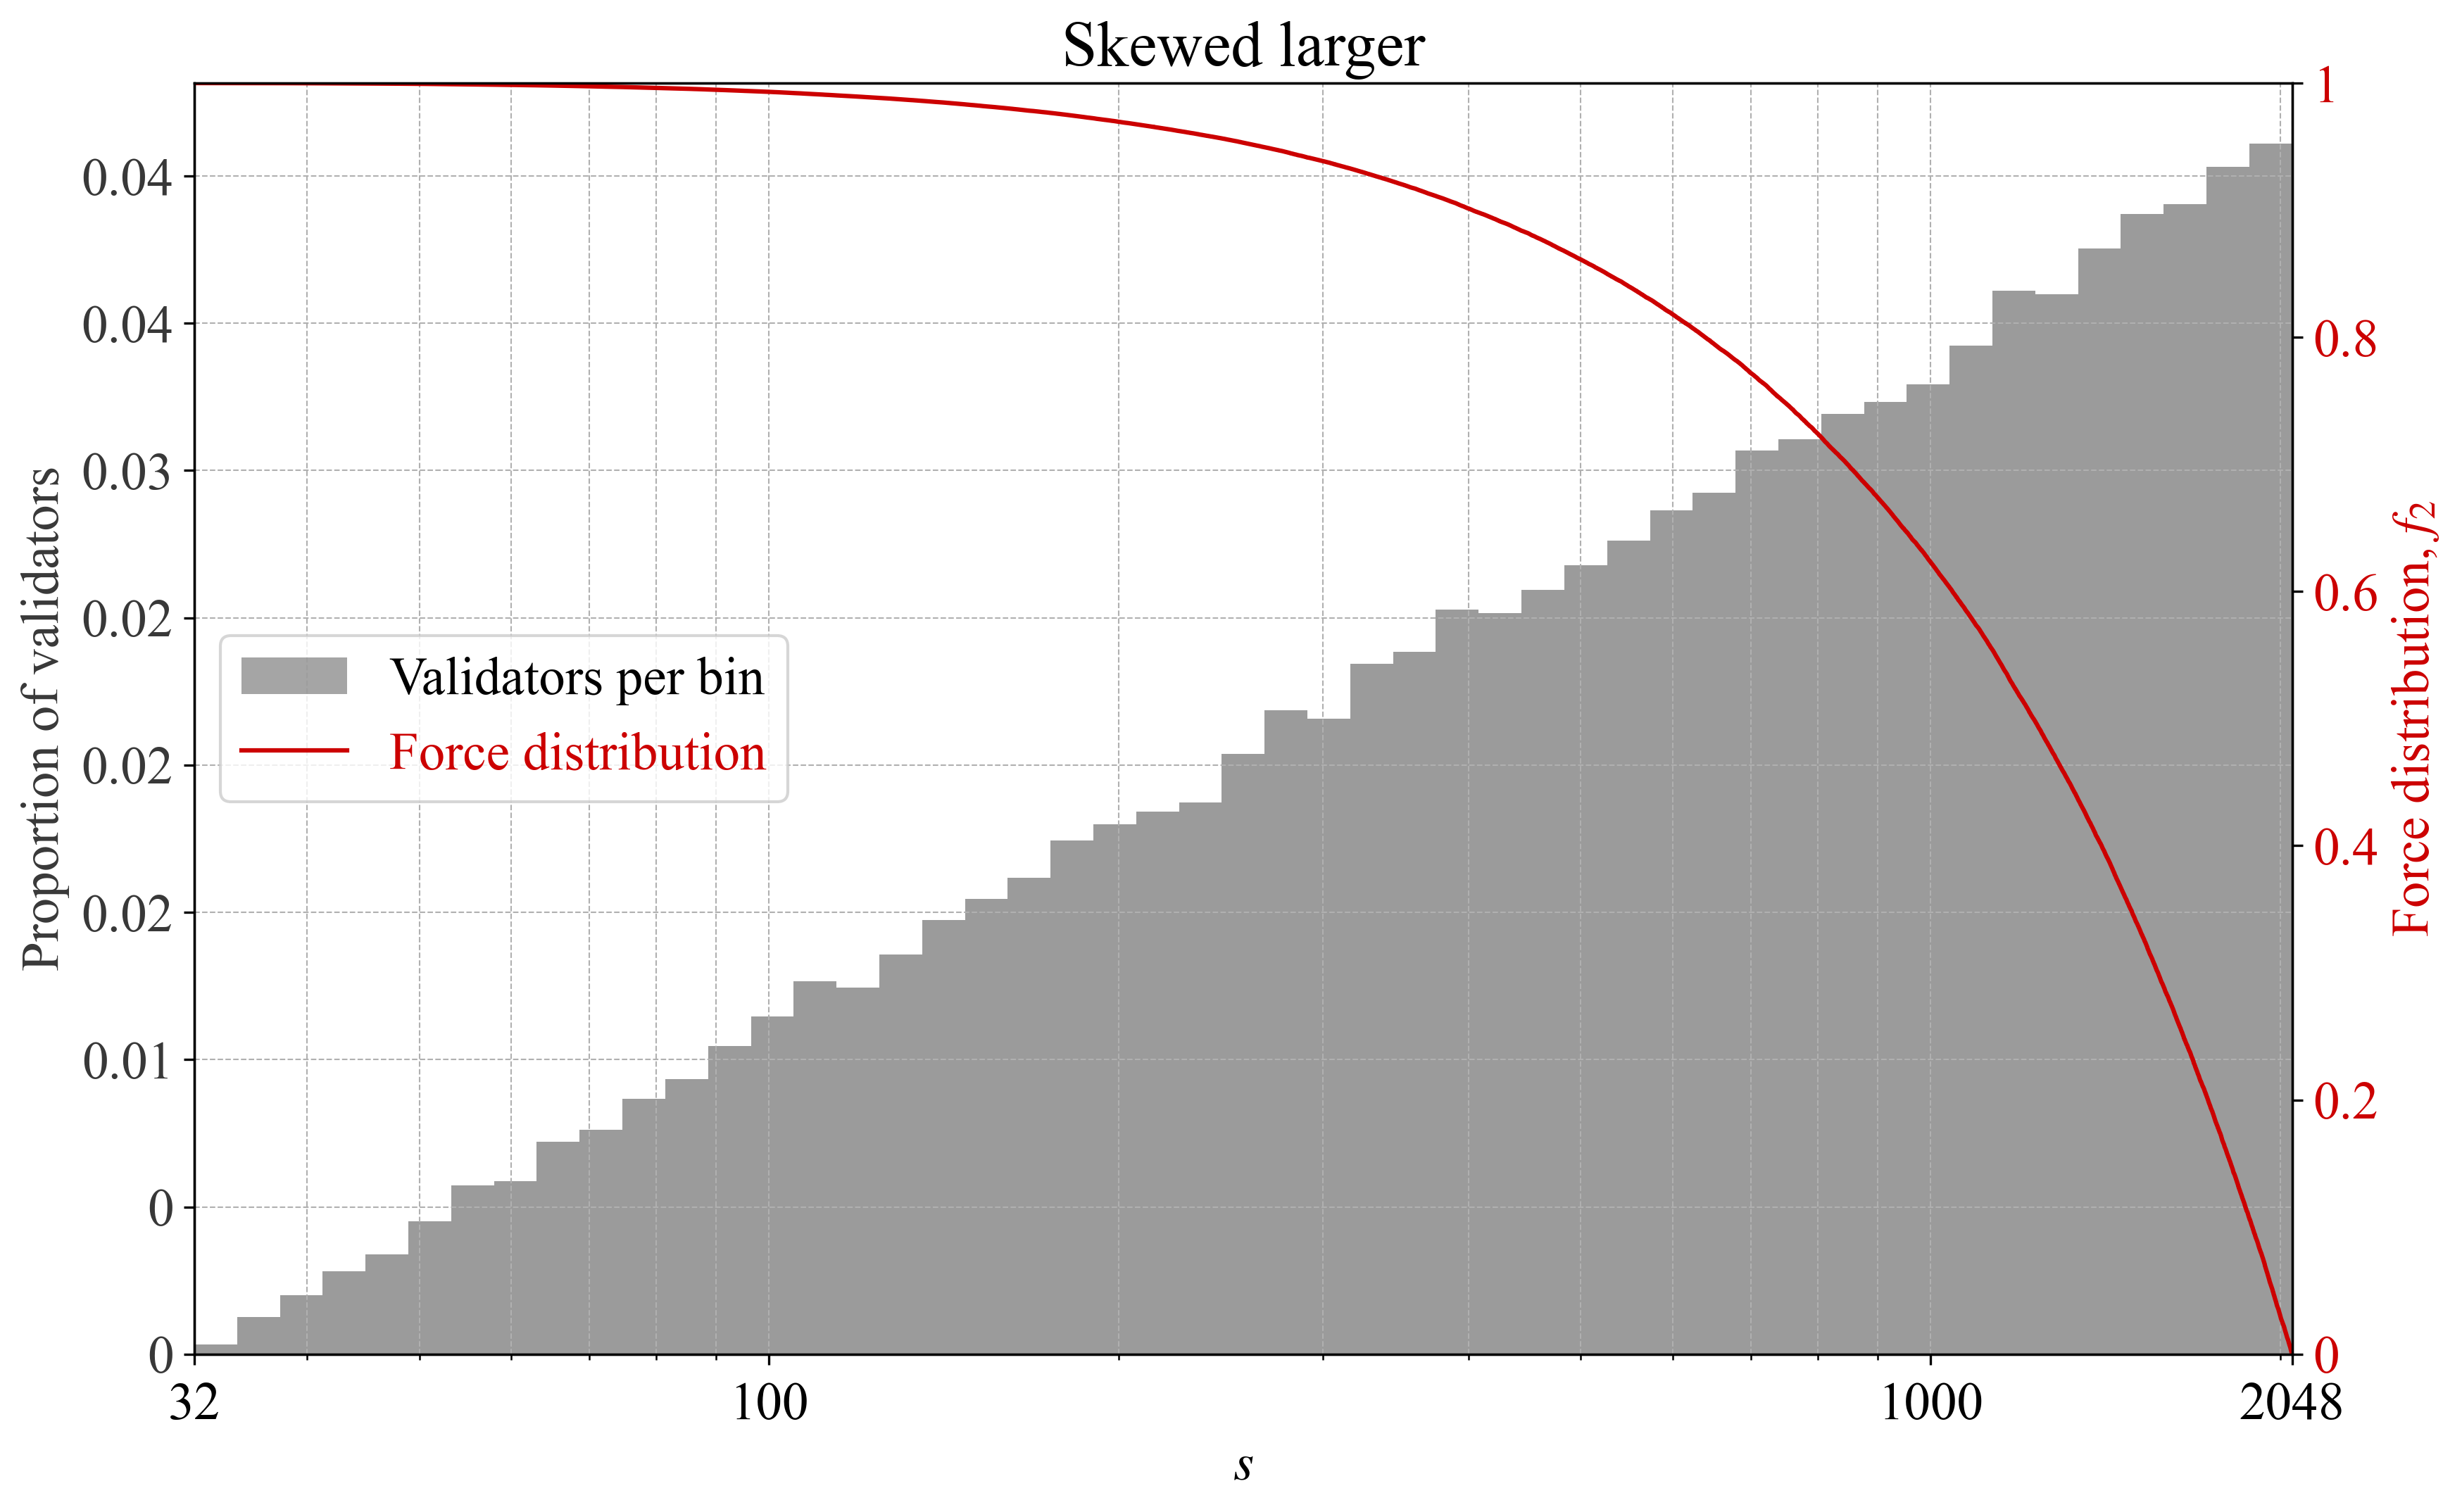
**Figure 6.** Force distribution $f_2$ under a validator set that skews larger plotted against number of validators per bin.

**Figure 7.** Force distribution $f_2$ under a validator set that skews larger plotted against total ETH per bin.

**Figure 8.** Force distribution $f_2$ under a validator set with local peaks plotted against number of validators per bin.

**Figure 9.** Force distribution $f_2$ under a validator set with local peaks plotted against total ETH per bin.
### 3.3 BID -- balancing between AID and CID
Naturally, a mixed measure of AID and CID here referred to as BID can be considered. This might strike the right balance, avoiding problematic aspects of both variants when used in isolation.
### 3.4 Issuance-neutral or attenuating individual incentives
The $F_1$ force will determine the scale of the individual incentives, thus specifying the difference between the largest and smallest validator. The $f_2$ measure specifies the distribution in between the two extremes. If the incentive is to be applied strictly as an attenuation, a validator receives an attenuation of $F_1f_2$. However, the individual incentives can also be approximately "issuance-neutral", meaning that it raises the yield for large validators and lowers it for small validators. This approach somewhat complicates the analysis and has certain edge cases, but at the same time can be beneficial when designing issuance policy.
### 4. Conclusion
A rough sketch of how to design consolidation incentives in Orbit has been provided. This framework will be further expanded upon as work on issuance policy and SSF progresses.