# dencun-devnet-10 blob analysis
## Introduction
Dencun-devnet-10 spec sheet can be found [here](https://notes.ethereum.org/@ethpandaops/dencun-devnet-10). It basically contains every EIP and change that will go into the mainnet Cancun fork. We have already found some issues and they have been logged in the bugs field.
Dencun happened at epoch 256. This would map to the time `October 24,12:18:24 PM UTC`
Test setup:
- Network genesis with capella state
- Manual EIP-4788 contract deployment
- Stable blob spamming (targeting 3 blobs always, no overloading of mempool)
- Transaction and blob fuzzer running
- Deposits and withdrawals submitted
Future tests:
- Blob spamming to fill up mempool (attempt 6 blobs as often as possible)
- Blobber submitting malicious blobs
- Bad block generator
## Node split
The devnet has >330k validators. We needed to hit this number in order to test the churn limit EIP and chose the boundary between 4->5. Most client teams have the same number of validators (i.e, not mainnet representative).
We have three classes of nodes, x86(medium), x86(large) and ARM. There will be a second ARM class being added in soon.
**x86(medium):** 4 vCPU, 16GB RAM, 100 GB SSD (one of each client pair)
**x86(large):** 8 vCPU, 16GB RAM, 100GB SSD (all teku-nethermind)
**ARM:** 8 vCPU(ampere), 16GB RAM, 160GB SSD (lh-geth,lh-reth,lo-neth,nim-erigon,nim-neth,nim-reth,prysm-besu,teku-besu,teku-geth,teku-neth,teku-reth) (NO VALIDATORS)
#### Regions:
**x86:** New York, Amsterdam, San Francisco, Sydney
**ARM:** Germany
#### Validator splitup:
**CL:**
Lighthouse: 21% (72k)
Prysm: 21% (72k) -5k exiting currently
Teku: 21% (72k)
Lodestar: 14% (47k)
Nimbus: 21% (72k)
**EL:**
geth: 37.8% (125k)
nethermind: 30% (100k)
erigon: 15% (50k)
besu: 15% (50k)
ethjs: 1.5% (5k)
reth: 1.5% (5k)
## Resource usage
**Note: The graphs start at Oct 24th 12PM CEST and go on till 10 UTC on Oct 25th. Dencun happens at Oct 24th, 2:18PM CEST. All graph times are in CEST.**
### Overall CPU:
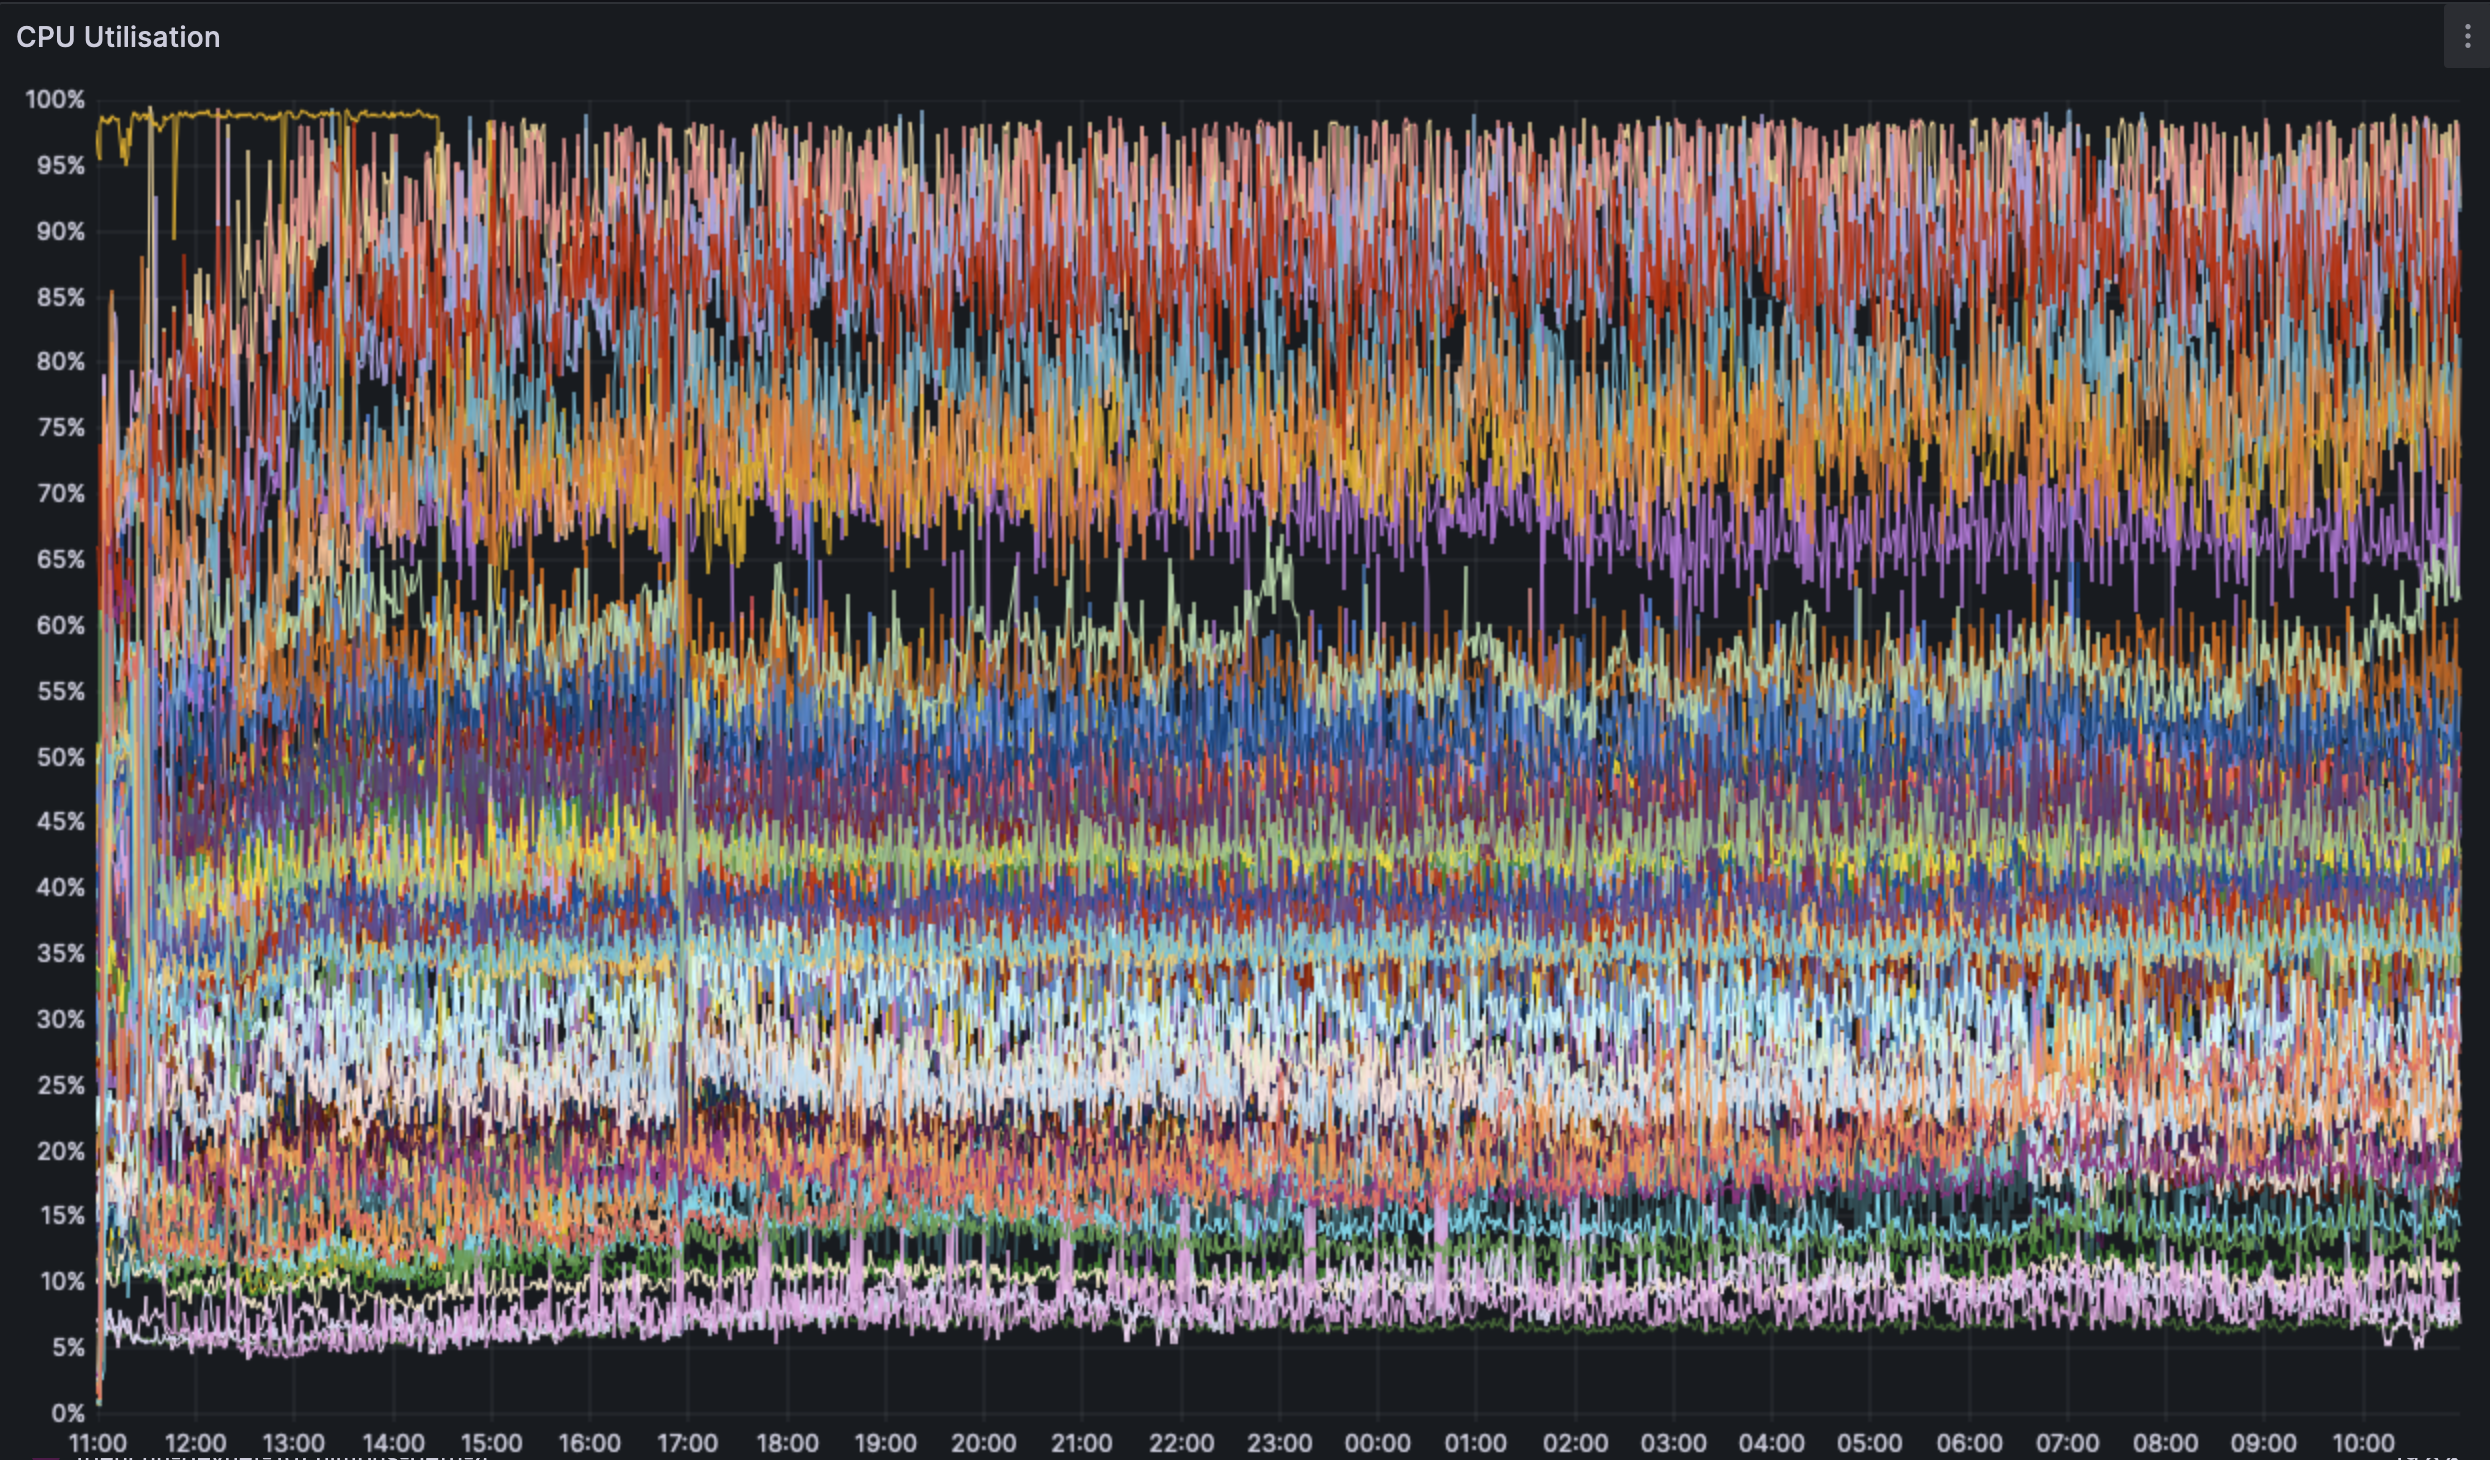
We see no measurable increase in CPU usage pre and post dencun fork. The higher end of the usage spectrum tops out at ~80% (With some minor outliers). This is good news considering that a stable number of blobs being included doesn't yield a massive CPU increase. We will re-test this assumption with the mempool being spammed to its limits.
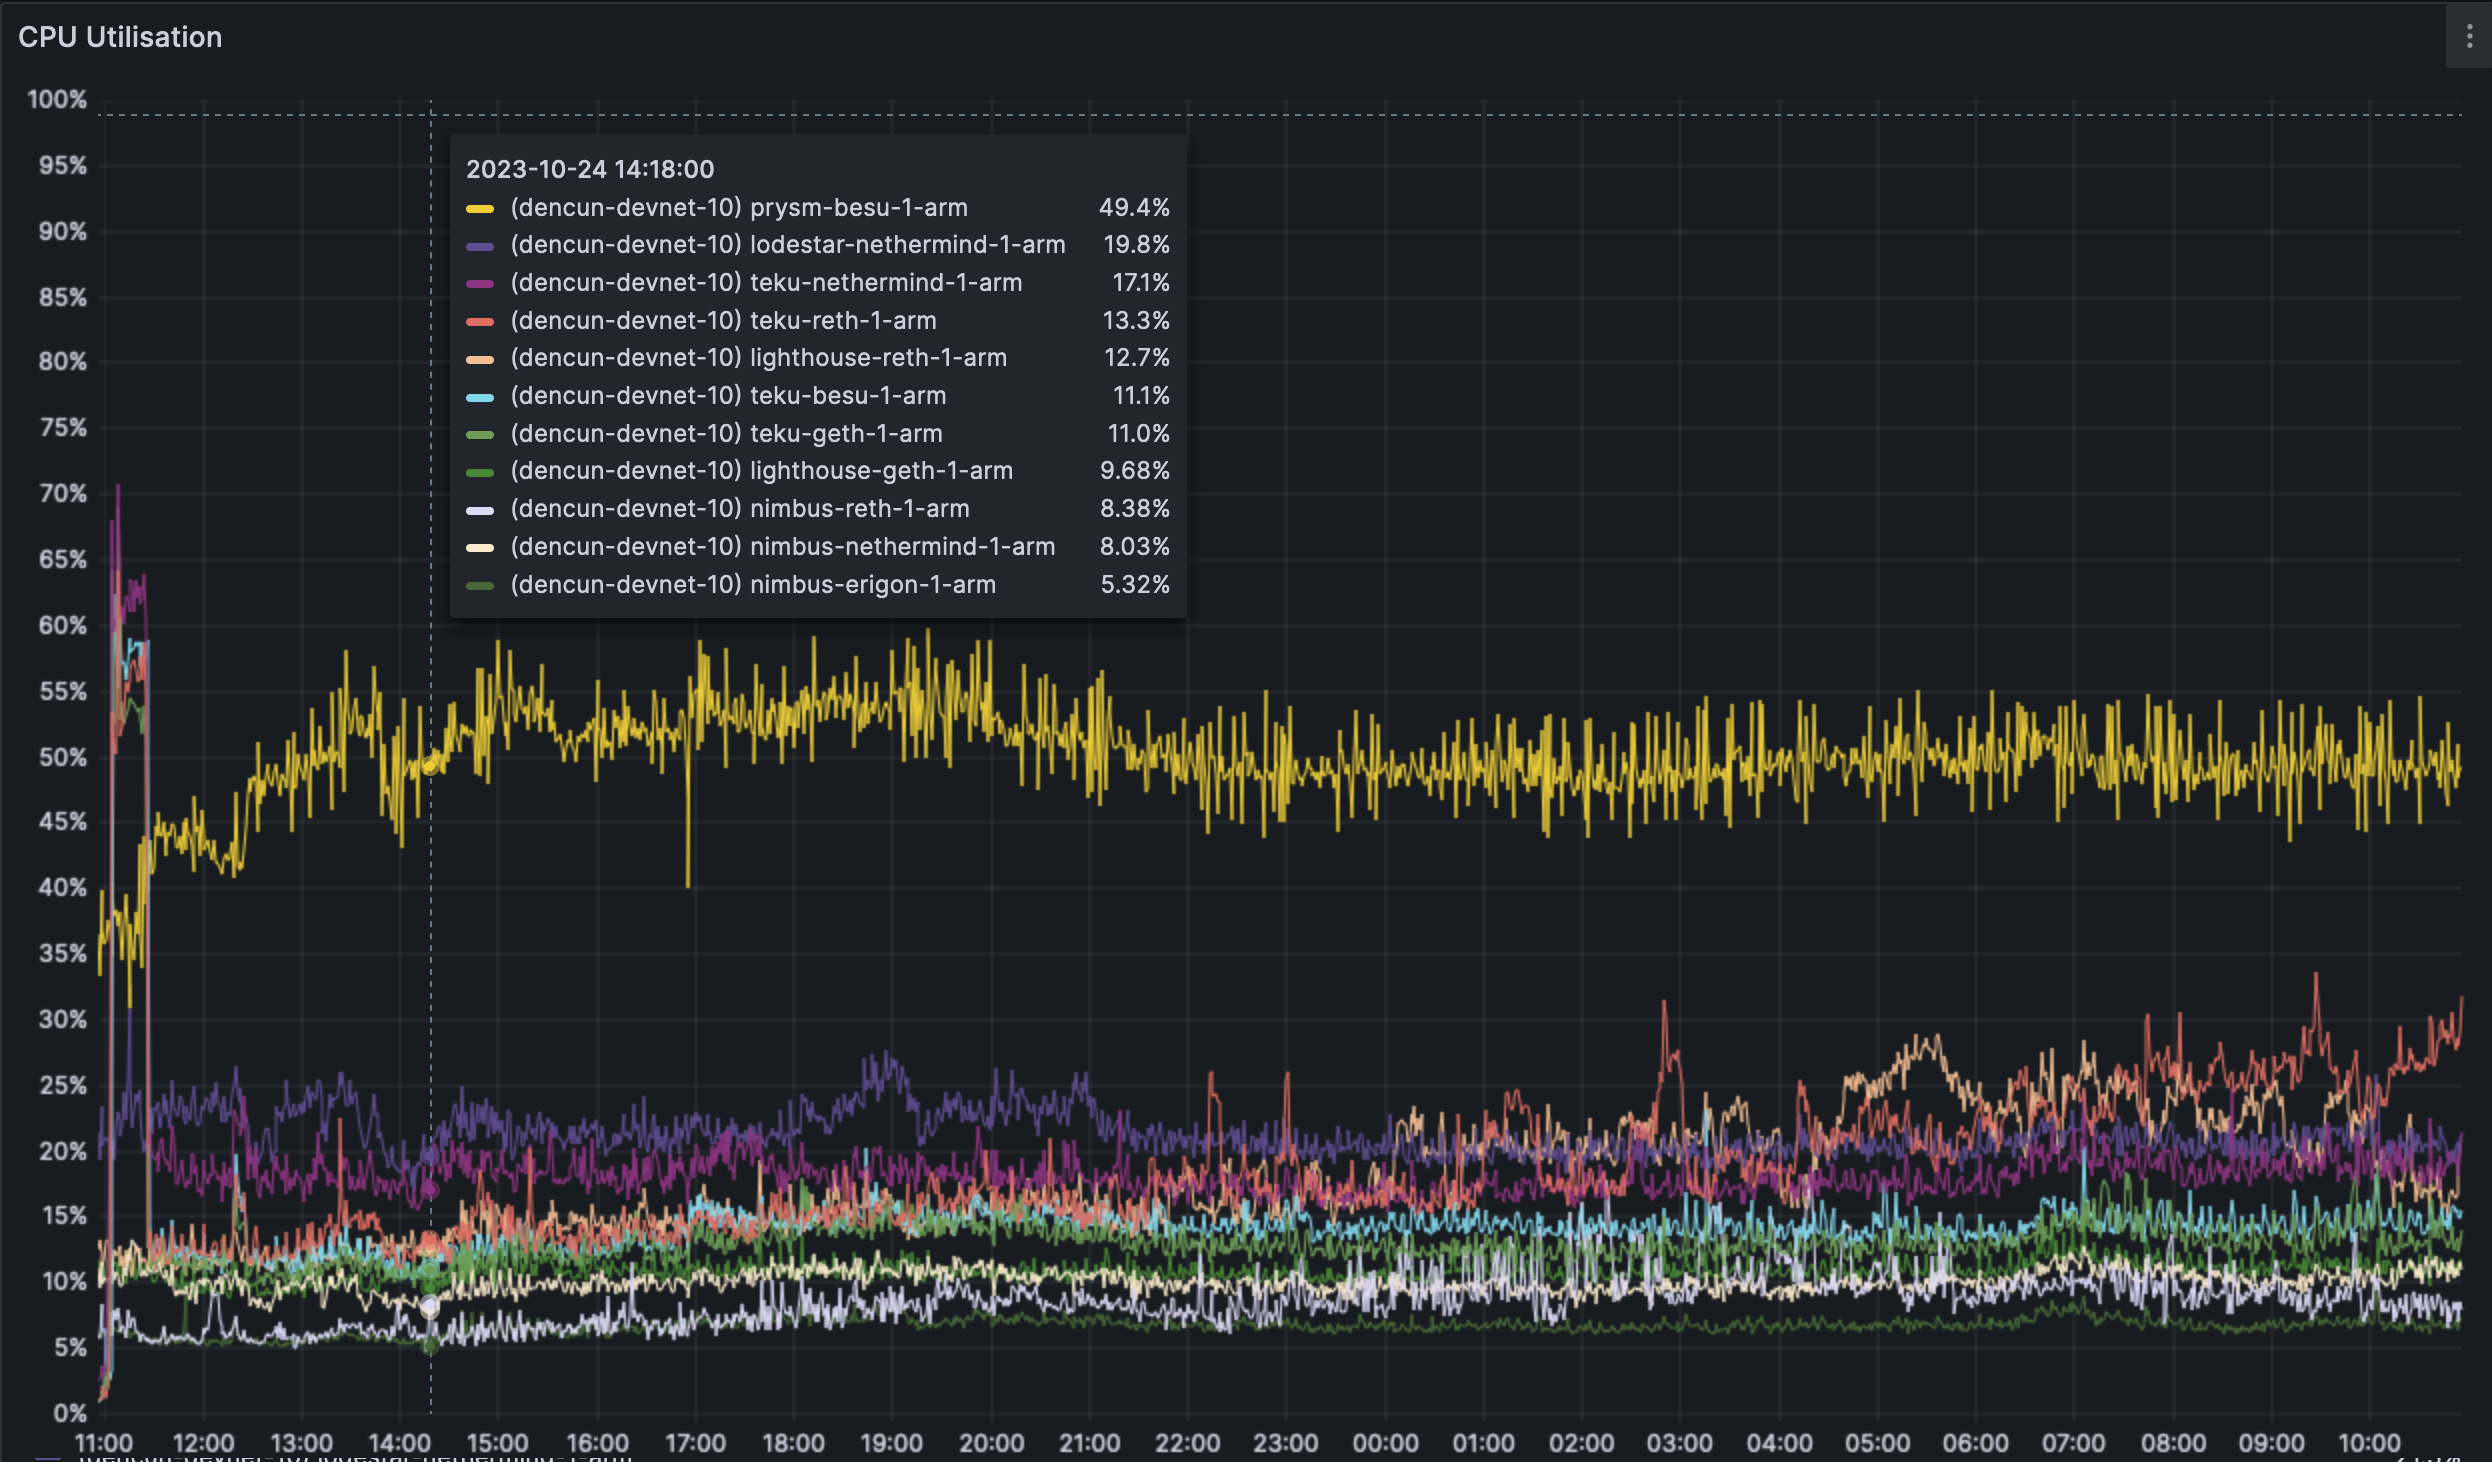
The ARM machines perform extremely well, with the outlier being prysm-besu. Even on the outlier, the ARM machines have far lower CPU usage compared to x86 machines, this is however expected as the ARM nodes are purely tracking the chain whereas x86 nodes are running validators as well.
For a deeper introspection of the CPU, please check our grafana dashboard [here](https://grafana.observability.ethpandaops.io/d/MRfYwus7k/nodes?orgId=1&refresh=1m&var-consensus_client=All&var-execution_client=All&var-network=dencun-devnet-10&var-filter=ingress_user%7C%21~%7Csynctest.%2A&from=now-24h&to=now&viewPanel=2).
### Overall RAM:
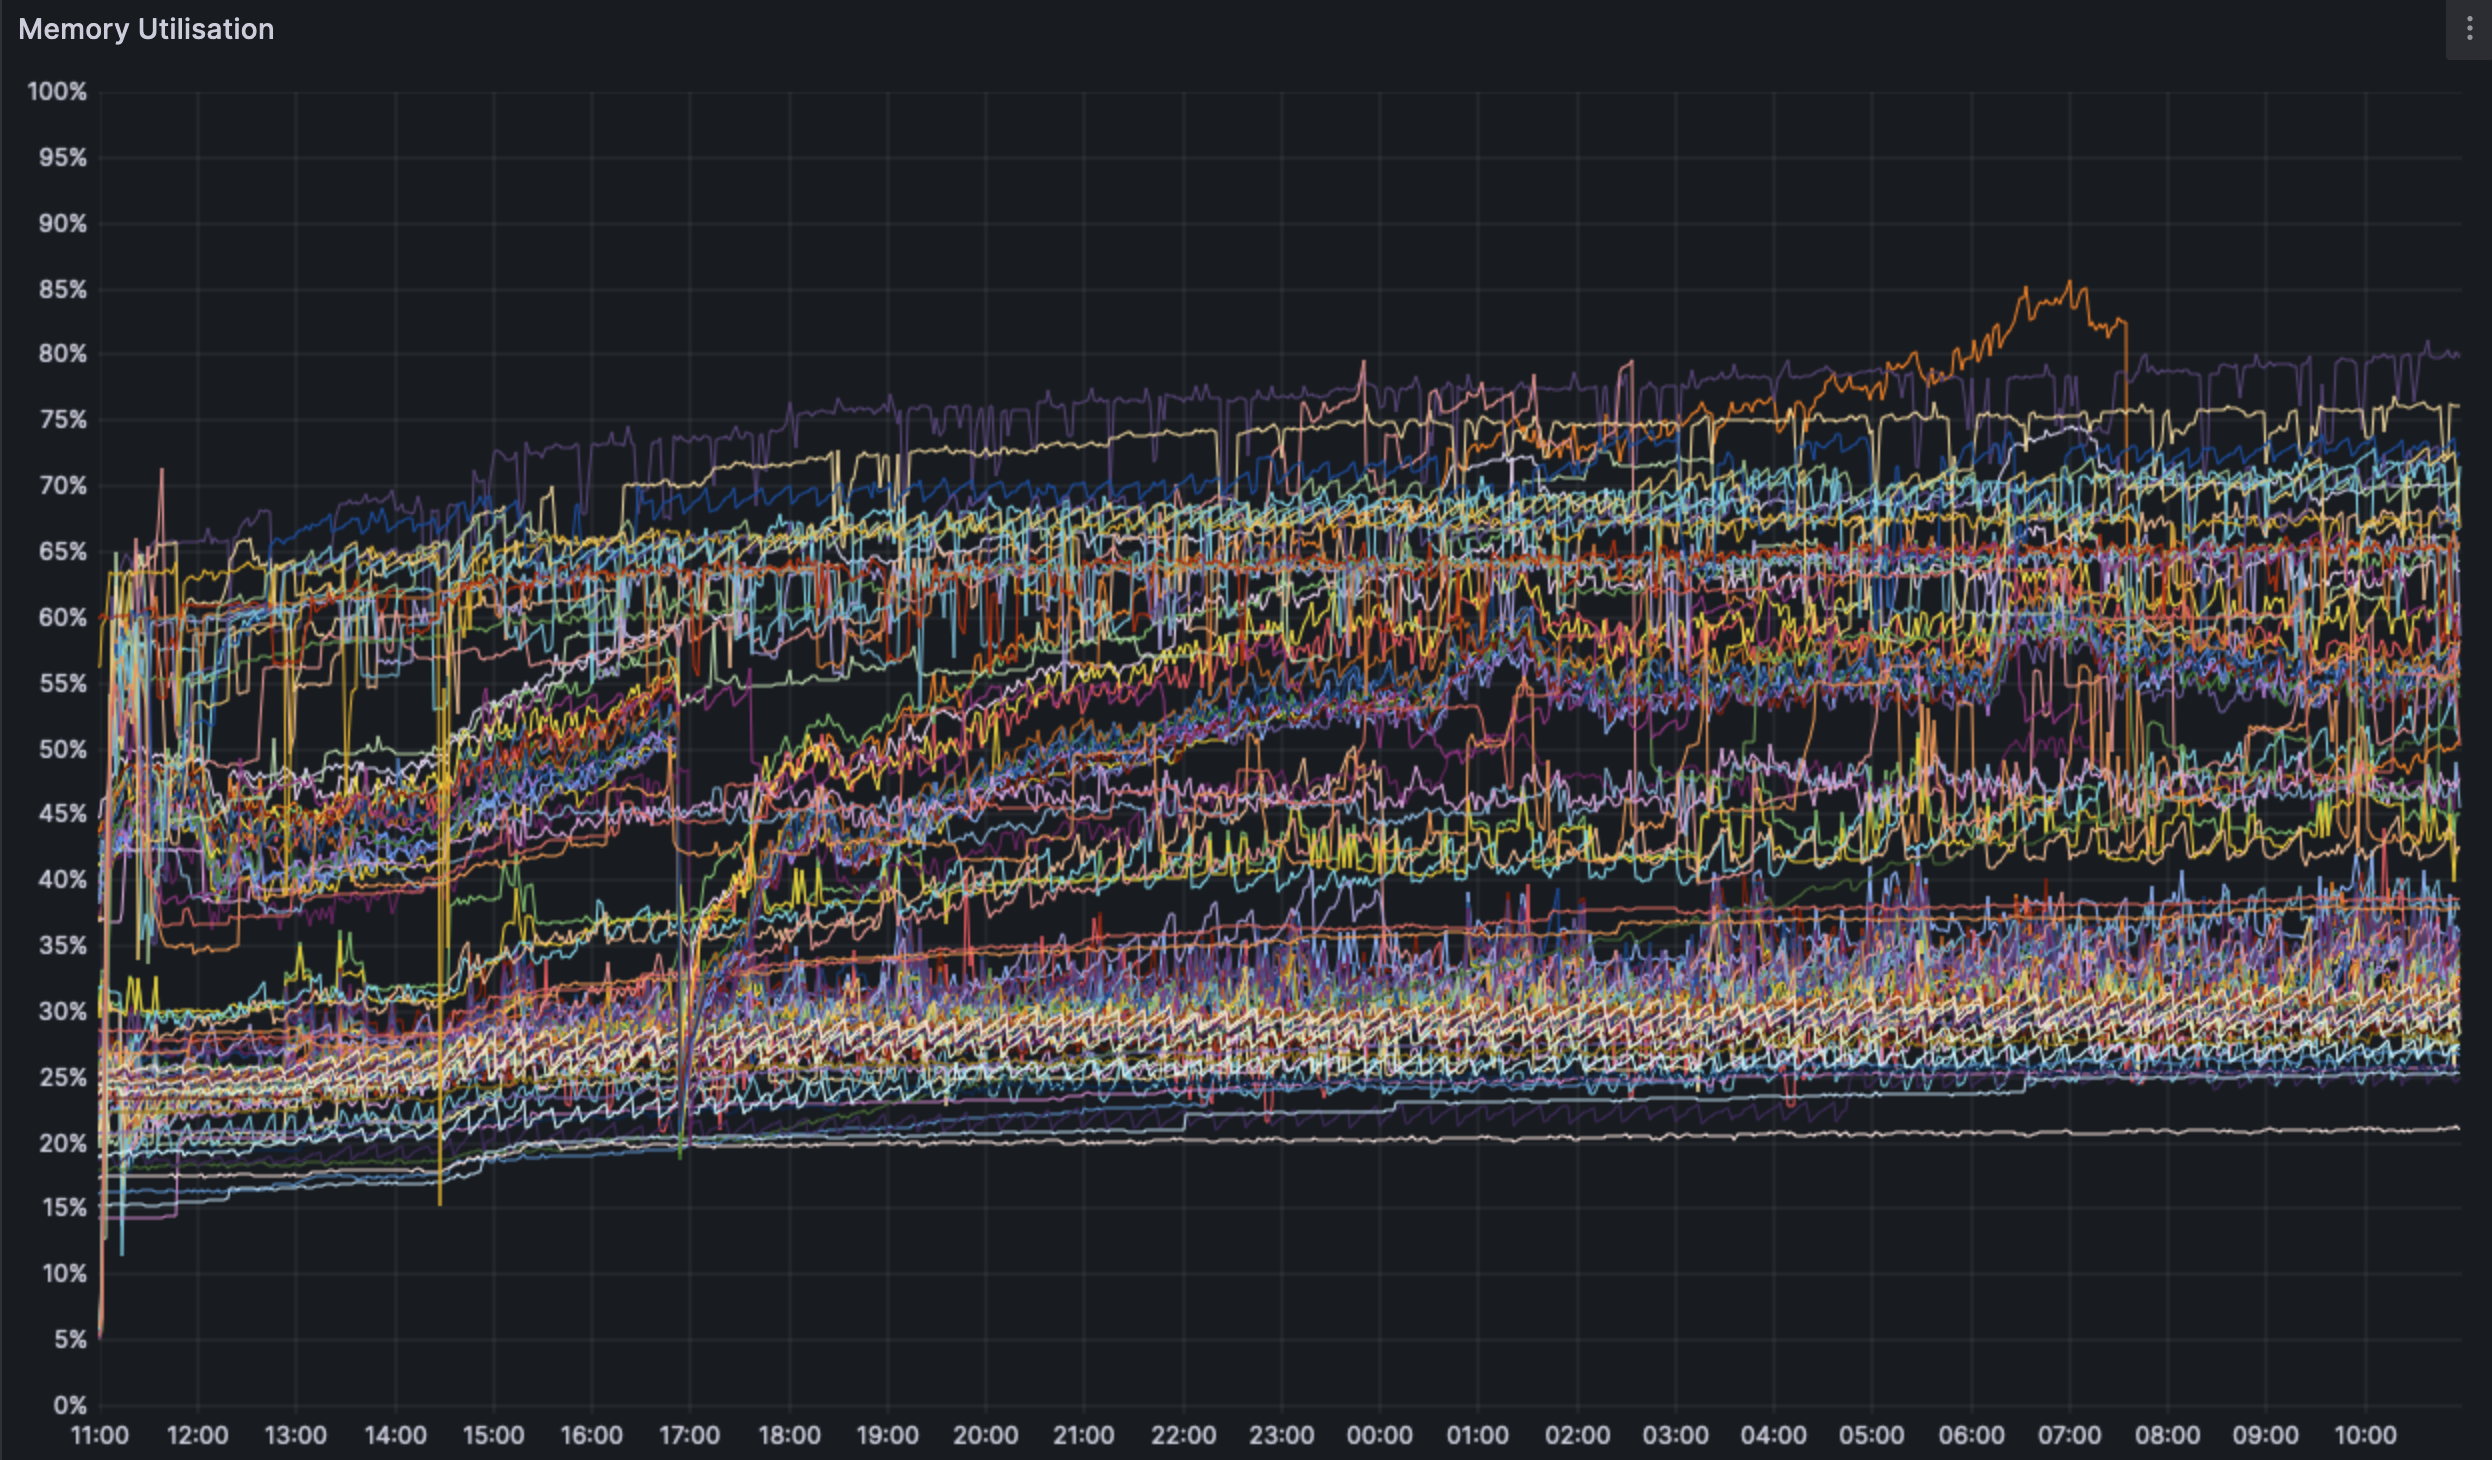
We can see a minor, but noticeable increase in RAM usage pre and post dencun fork. However, the highest RAM use seems to still top out at ~85% on 16GB machines. We do set memory limits on Java clients (Teku,Besu) but there are no limits set on any other client pair.
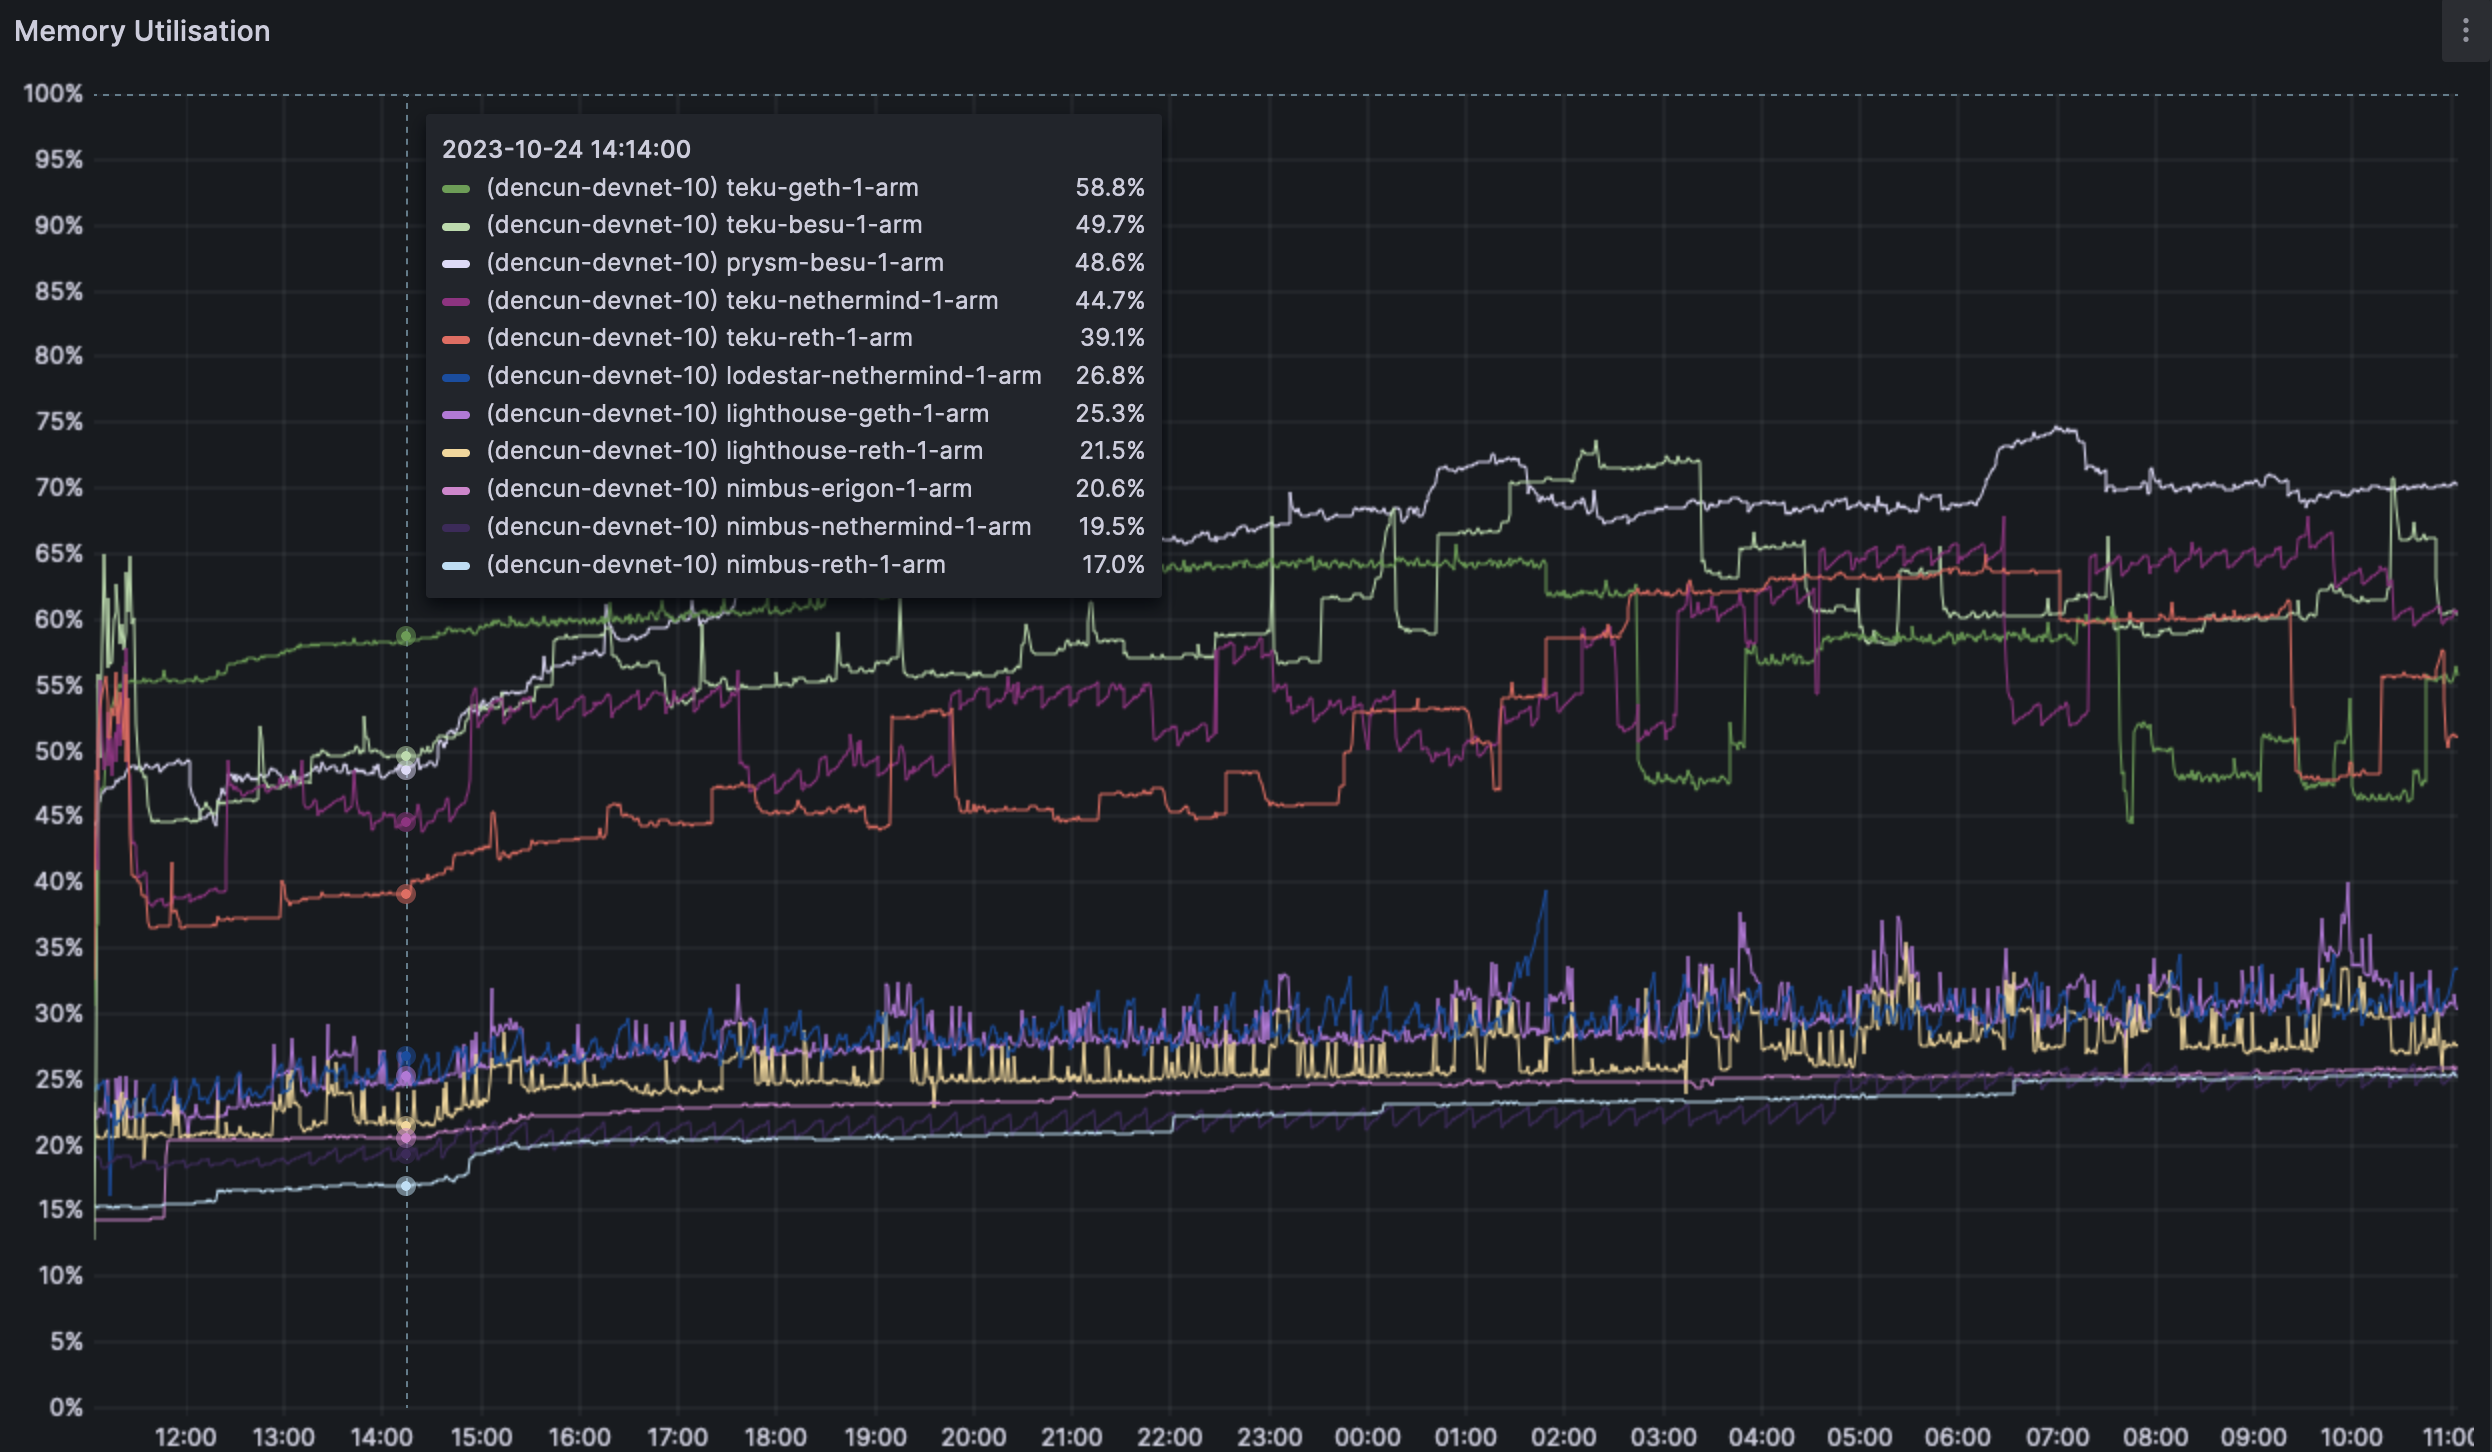
The ARM machines seem to fair similarly to their x86 counterparts. RAM usage seems to trend upwards post dencun fork and seems to top out at the ~76% mark on these 16GB RAM machines.
### Geth/Erigon network use
We currently are working on grabbing more accurate network usage metrics. We have geth metrics at hand and hence included them in the doc.
We can see an initial spike in the ingress 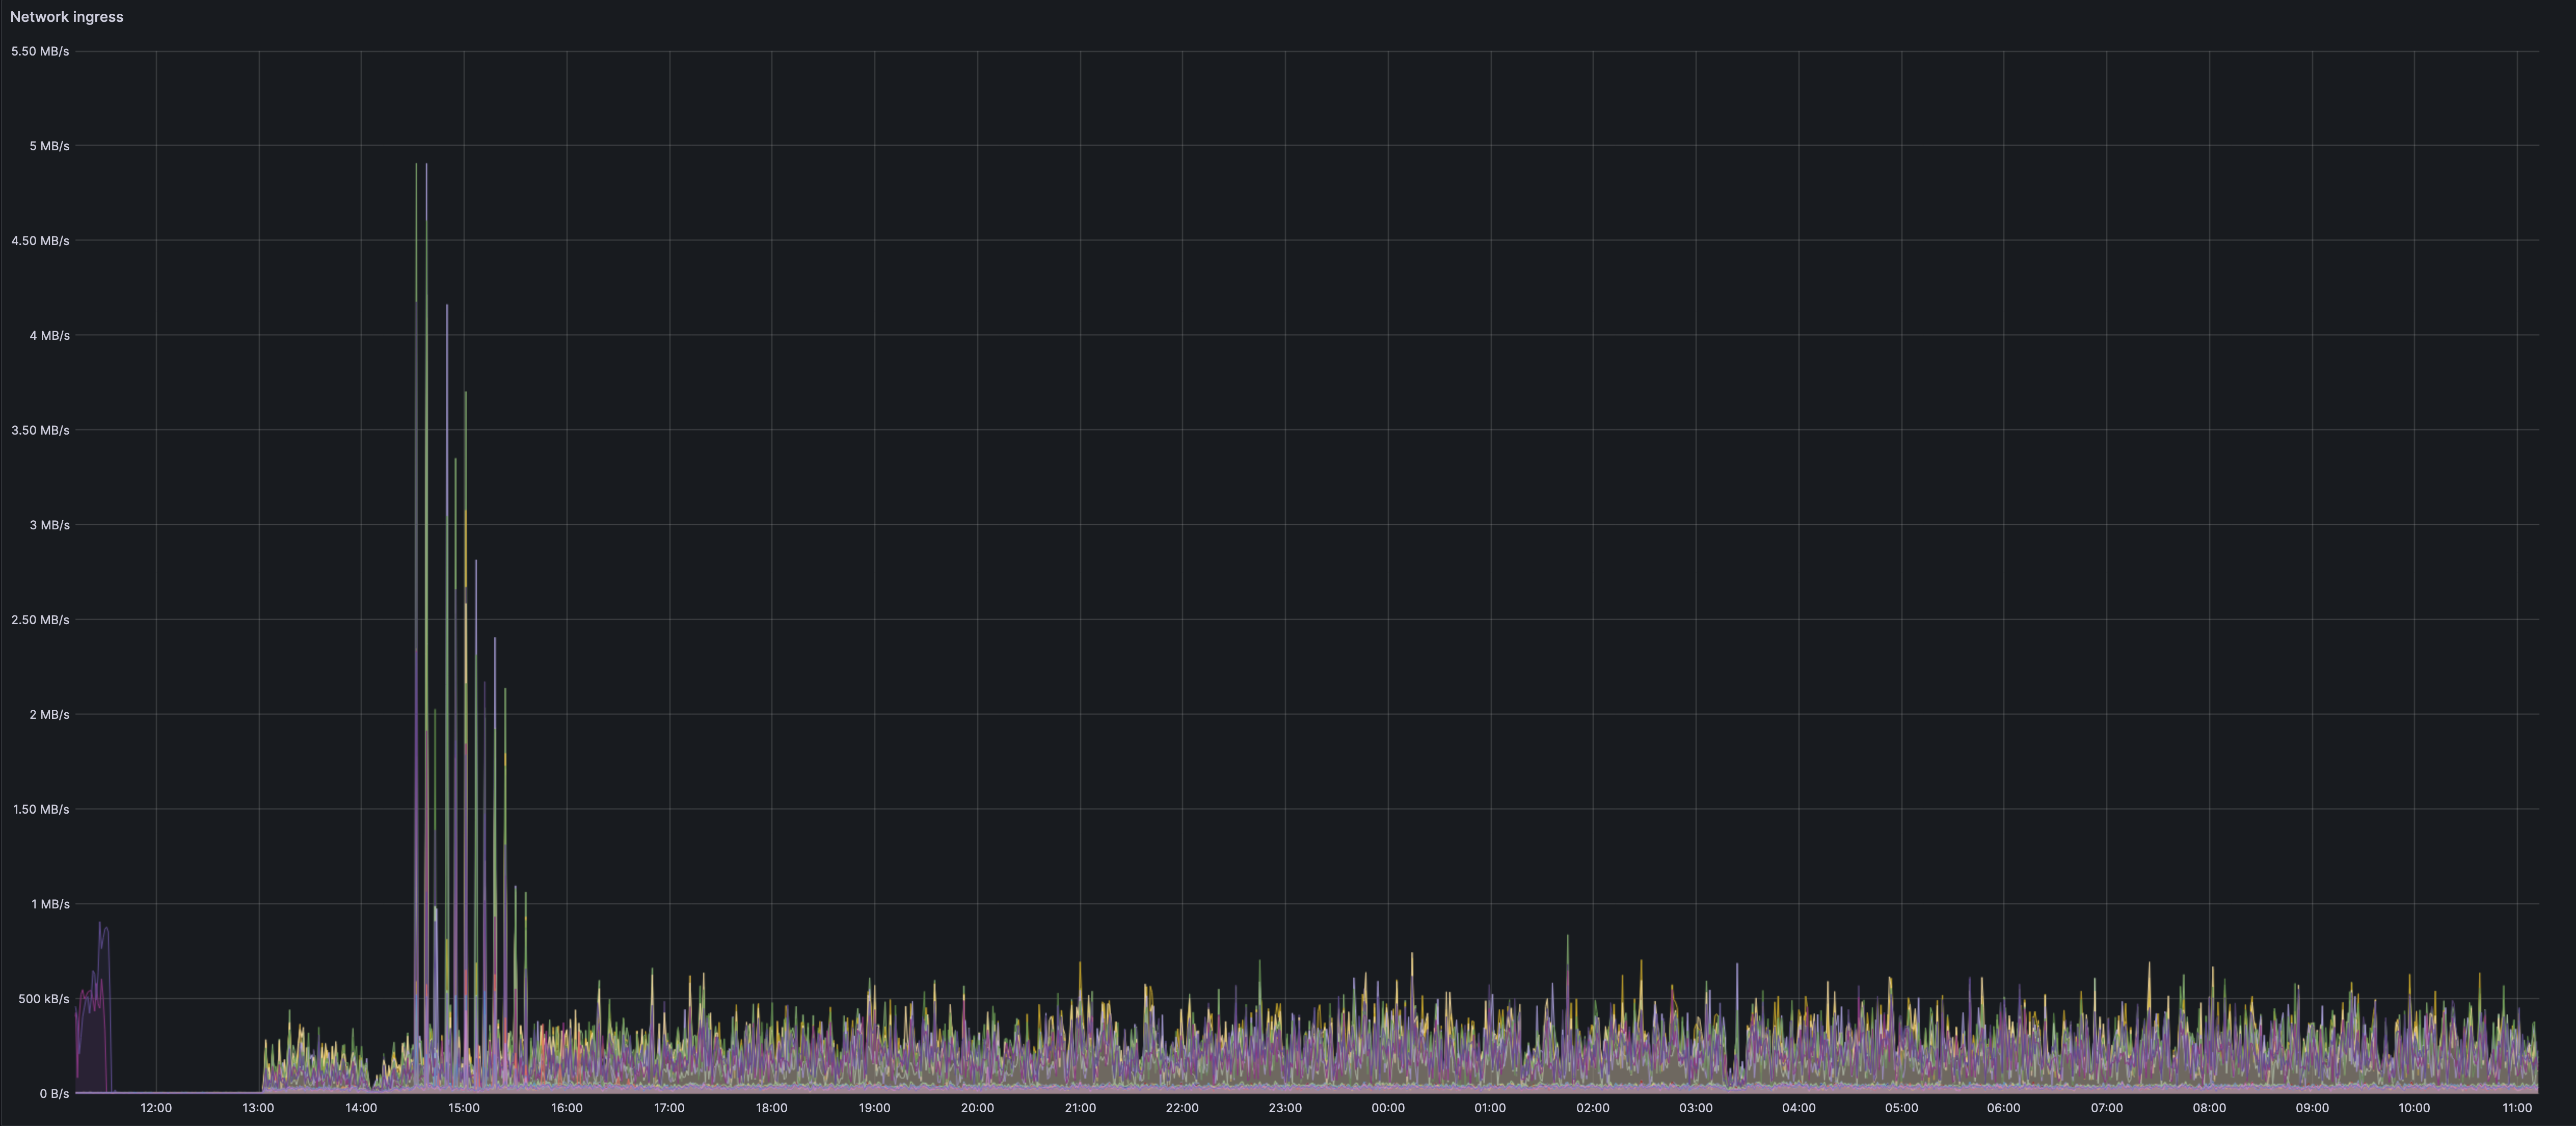
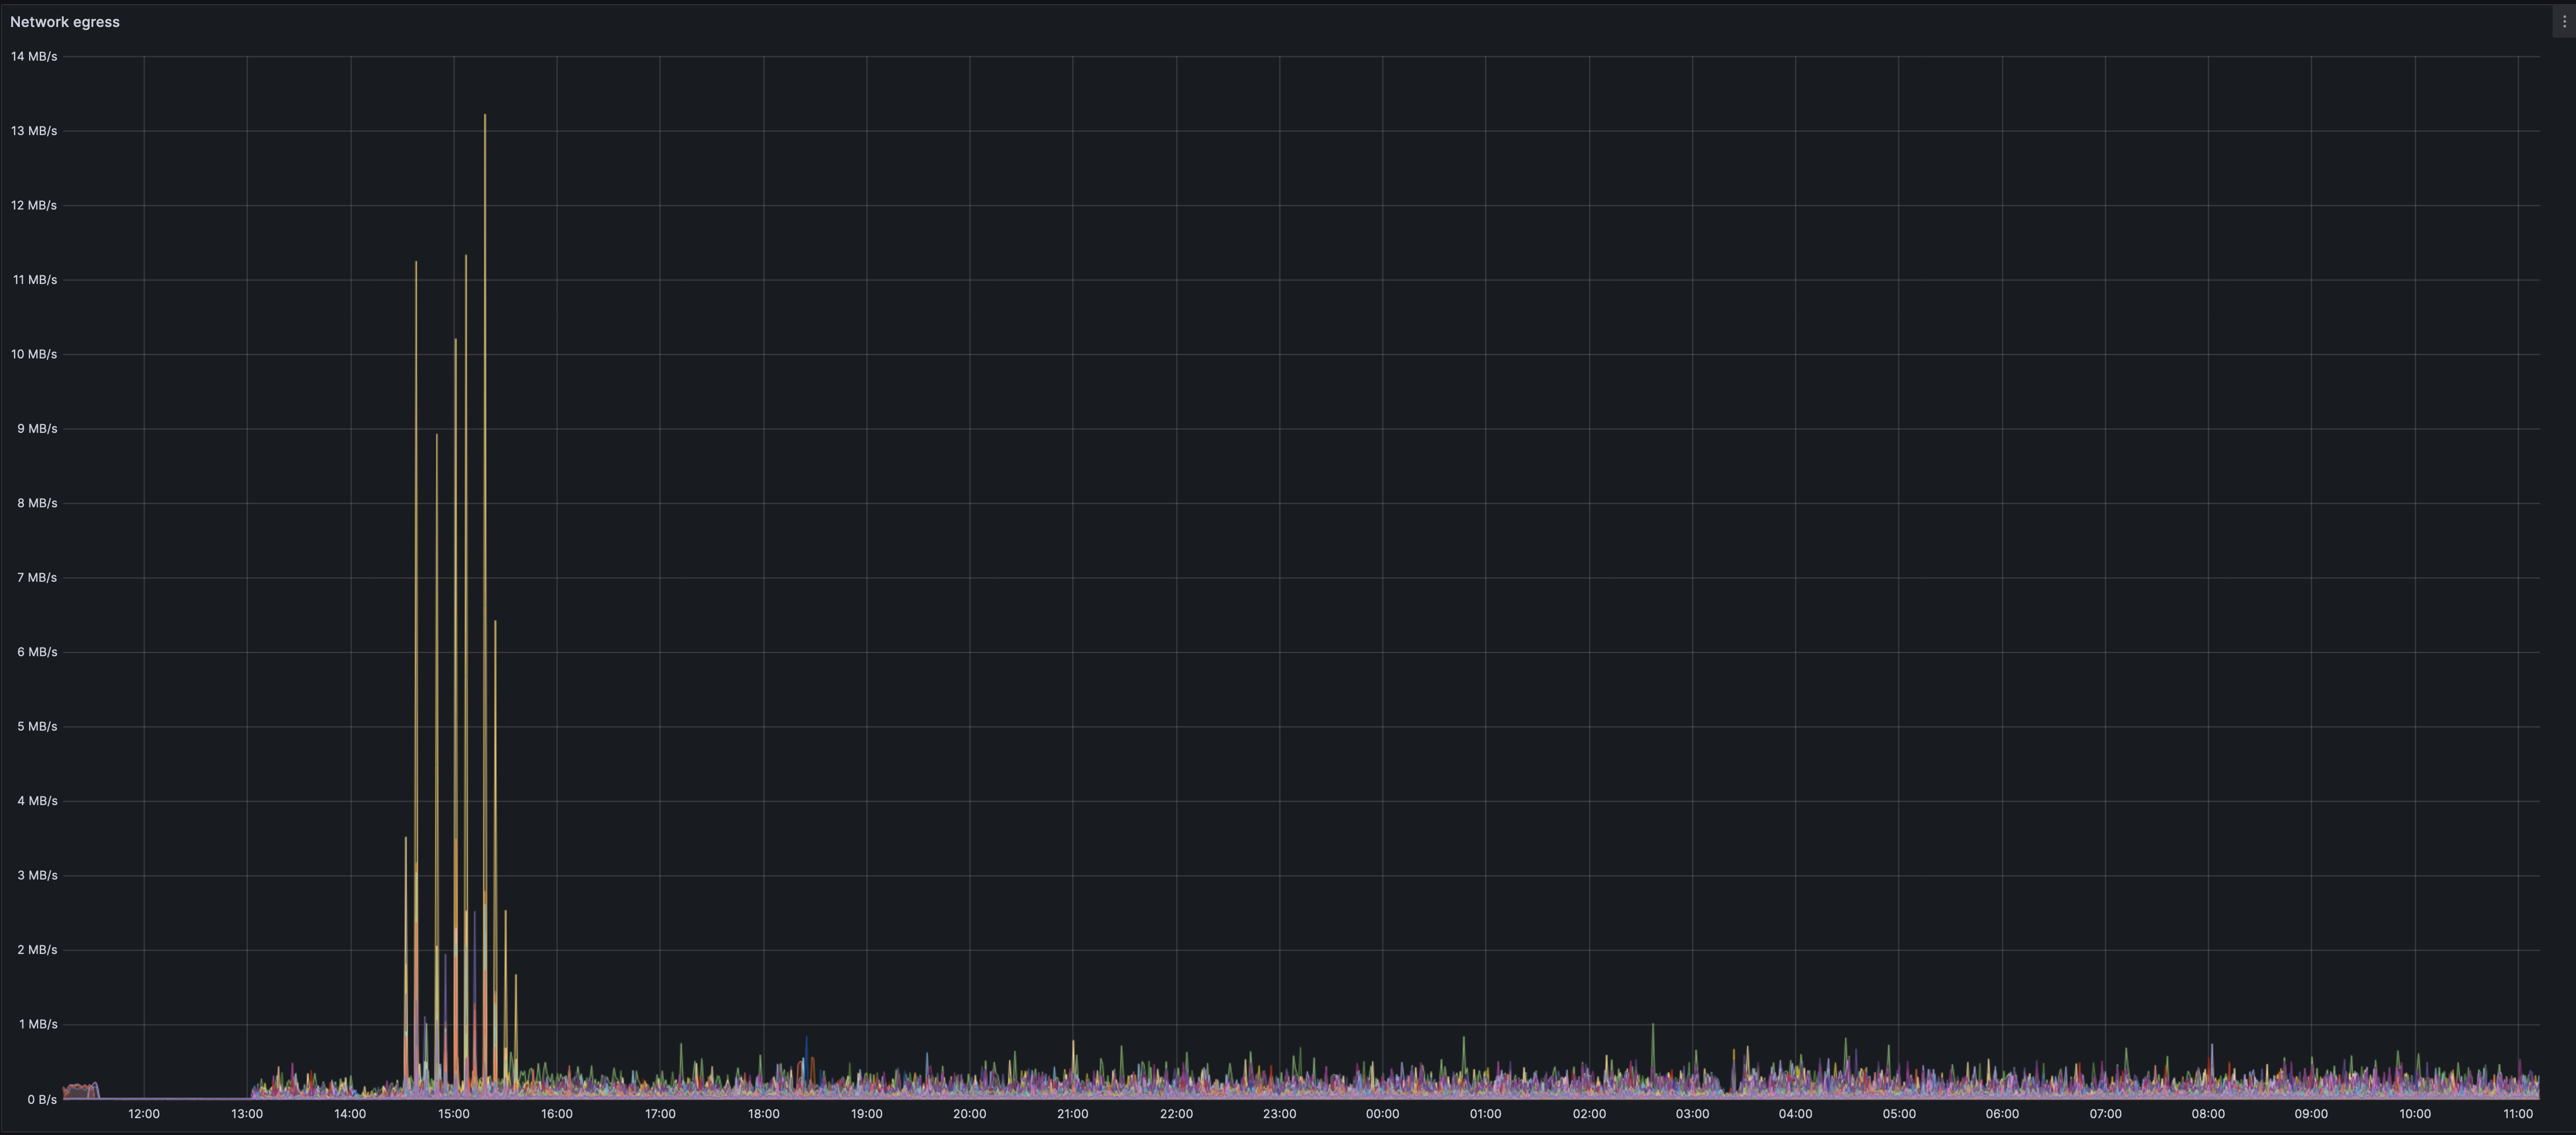
We see an interesting and un-expained spike on the network happening roughly 20-30mins after the dencun fork. The spike seems to mainly be from Erigon nodes. The biggest spike belongs to a lighthouse-erigon node.
This could very well co-incide with the spin up of blob spamming tools such as goomy-blob and tx-fuzz. The initial spam might lead to such a burst in the network use that gets spread over a longer duration in the sustained spamming. It could be that erigon has a sub-optimal fetcher during the initial burst. There probably are still holes in this theory, but it is my current working theory.
The other geth nodes seem to still have a small spike during the initial blob spamming. However this seems minor and the graph is far smoother.
Individual node metrics can be found [here](https://grafana.observability.ethpandaops.io/d/QC1Arp5Wk1/geth-single?orgId=1&var-instance=teku-geth-1-arm&var-percentile=0.5&var-filter=job%7C%3D%7Cexecution&refresh=1m&from=now-24h&to=now)
Aggregated geth/erigon node metrics can be found [here](https://grafana.observability.ethpandaops.io/d/Q31ATs5Zz1/geth-multiple?orgId=1&refresh=1m&var-filter=ingress_user%7C%3D%7Cdencun-devnet-10)
## Network health
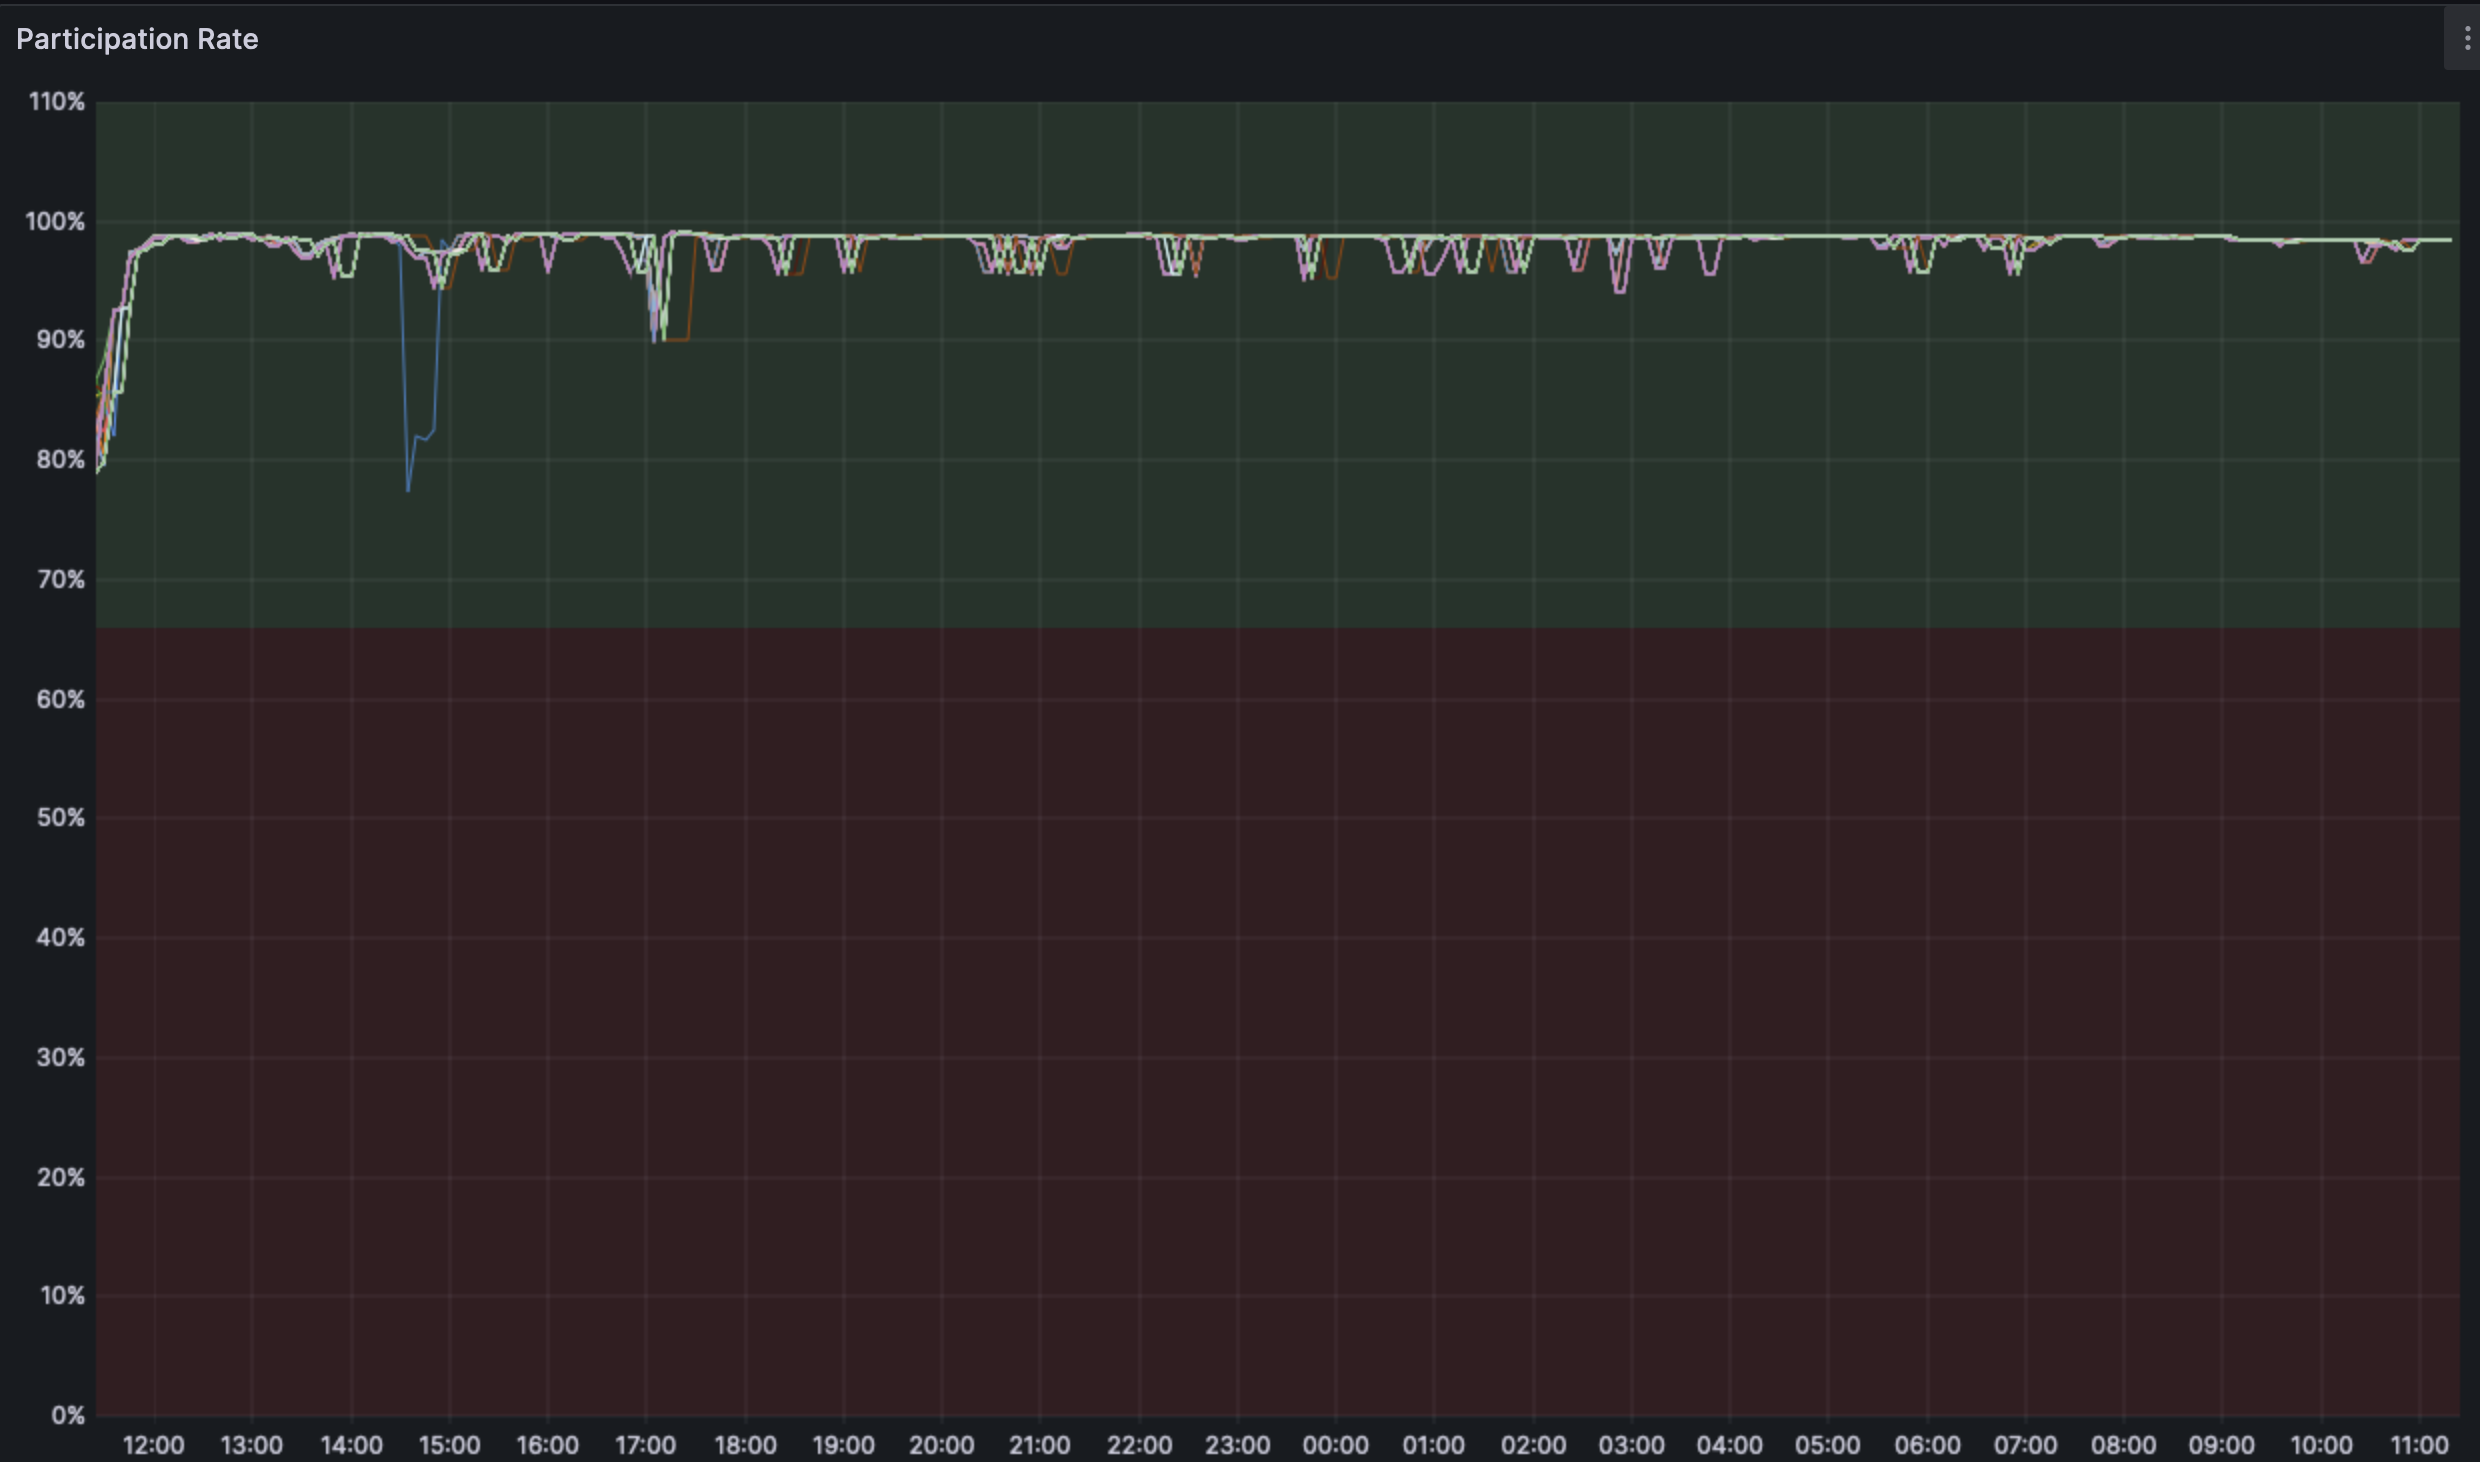
The participation rate is stable across the fork and outliers seem to be related to a resyncing node.
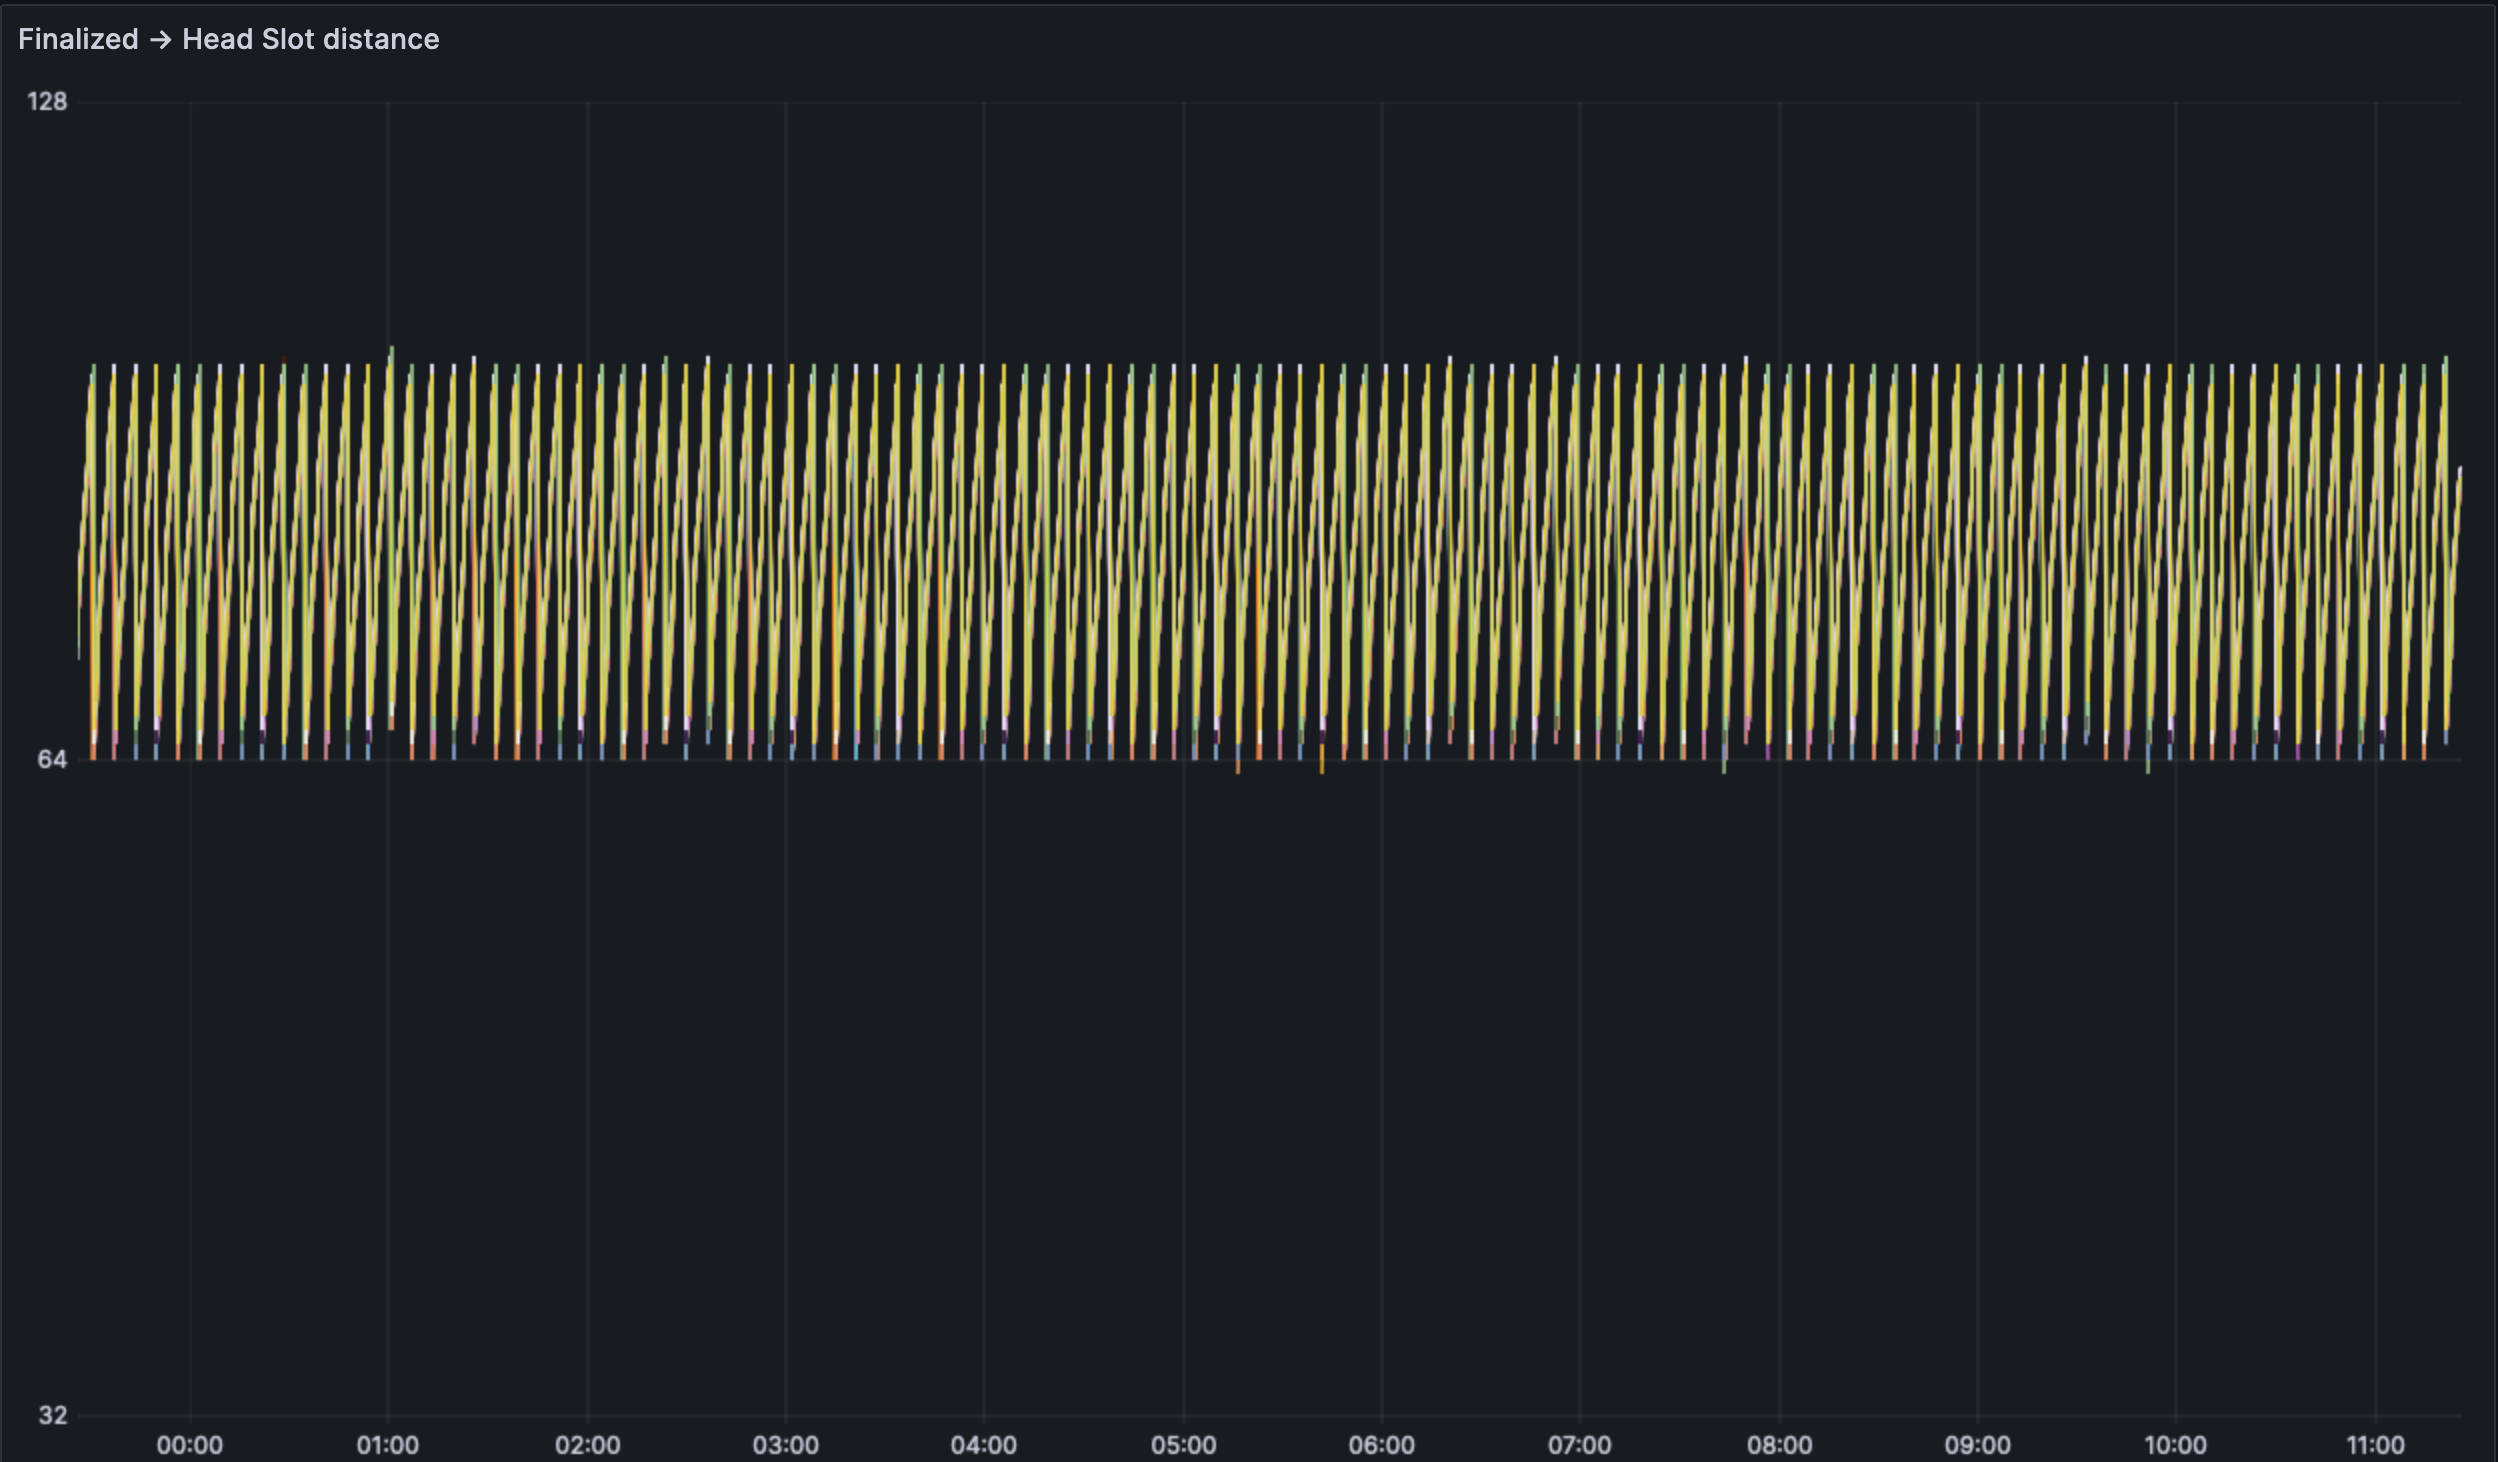
We see a regularly finalizing and healthy network at a high level.
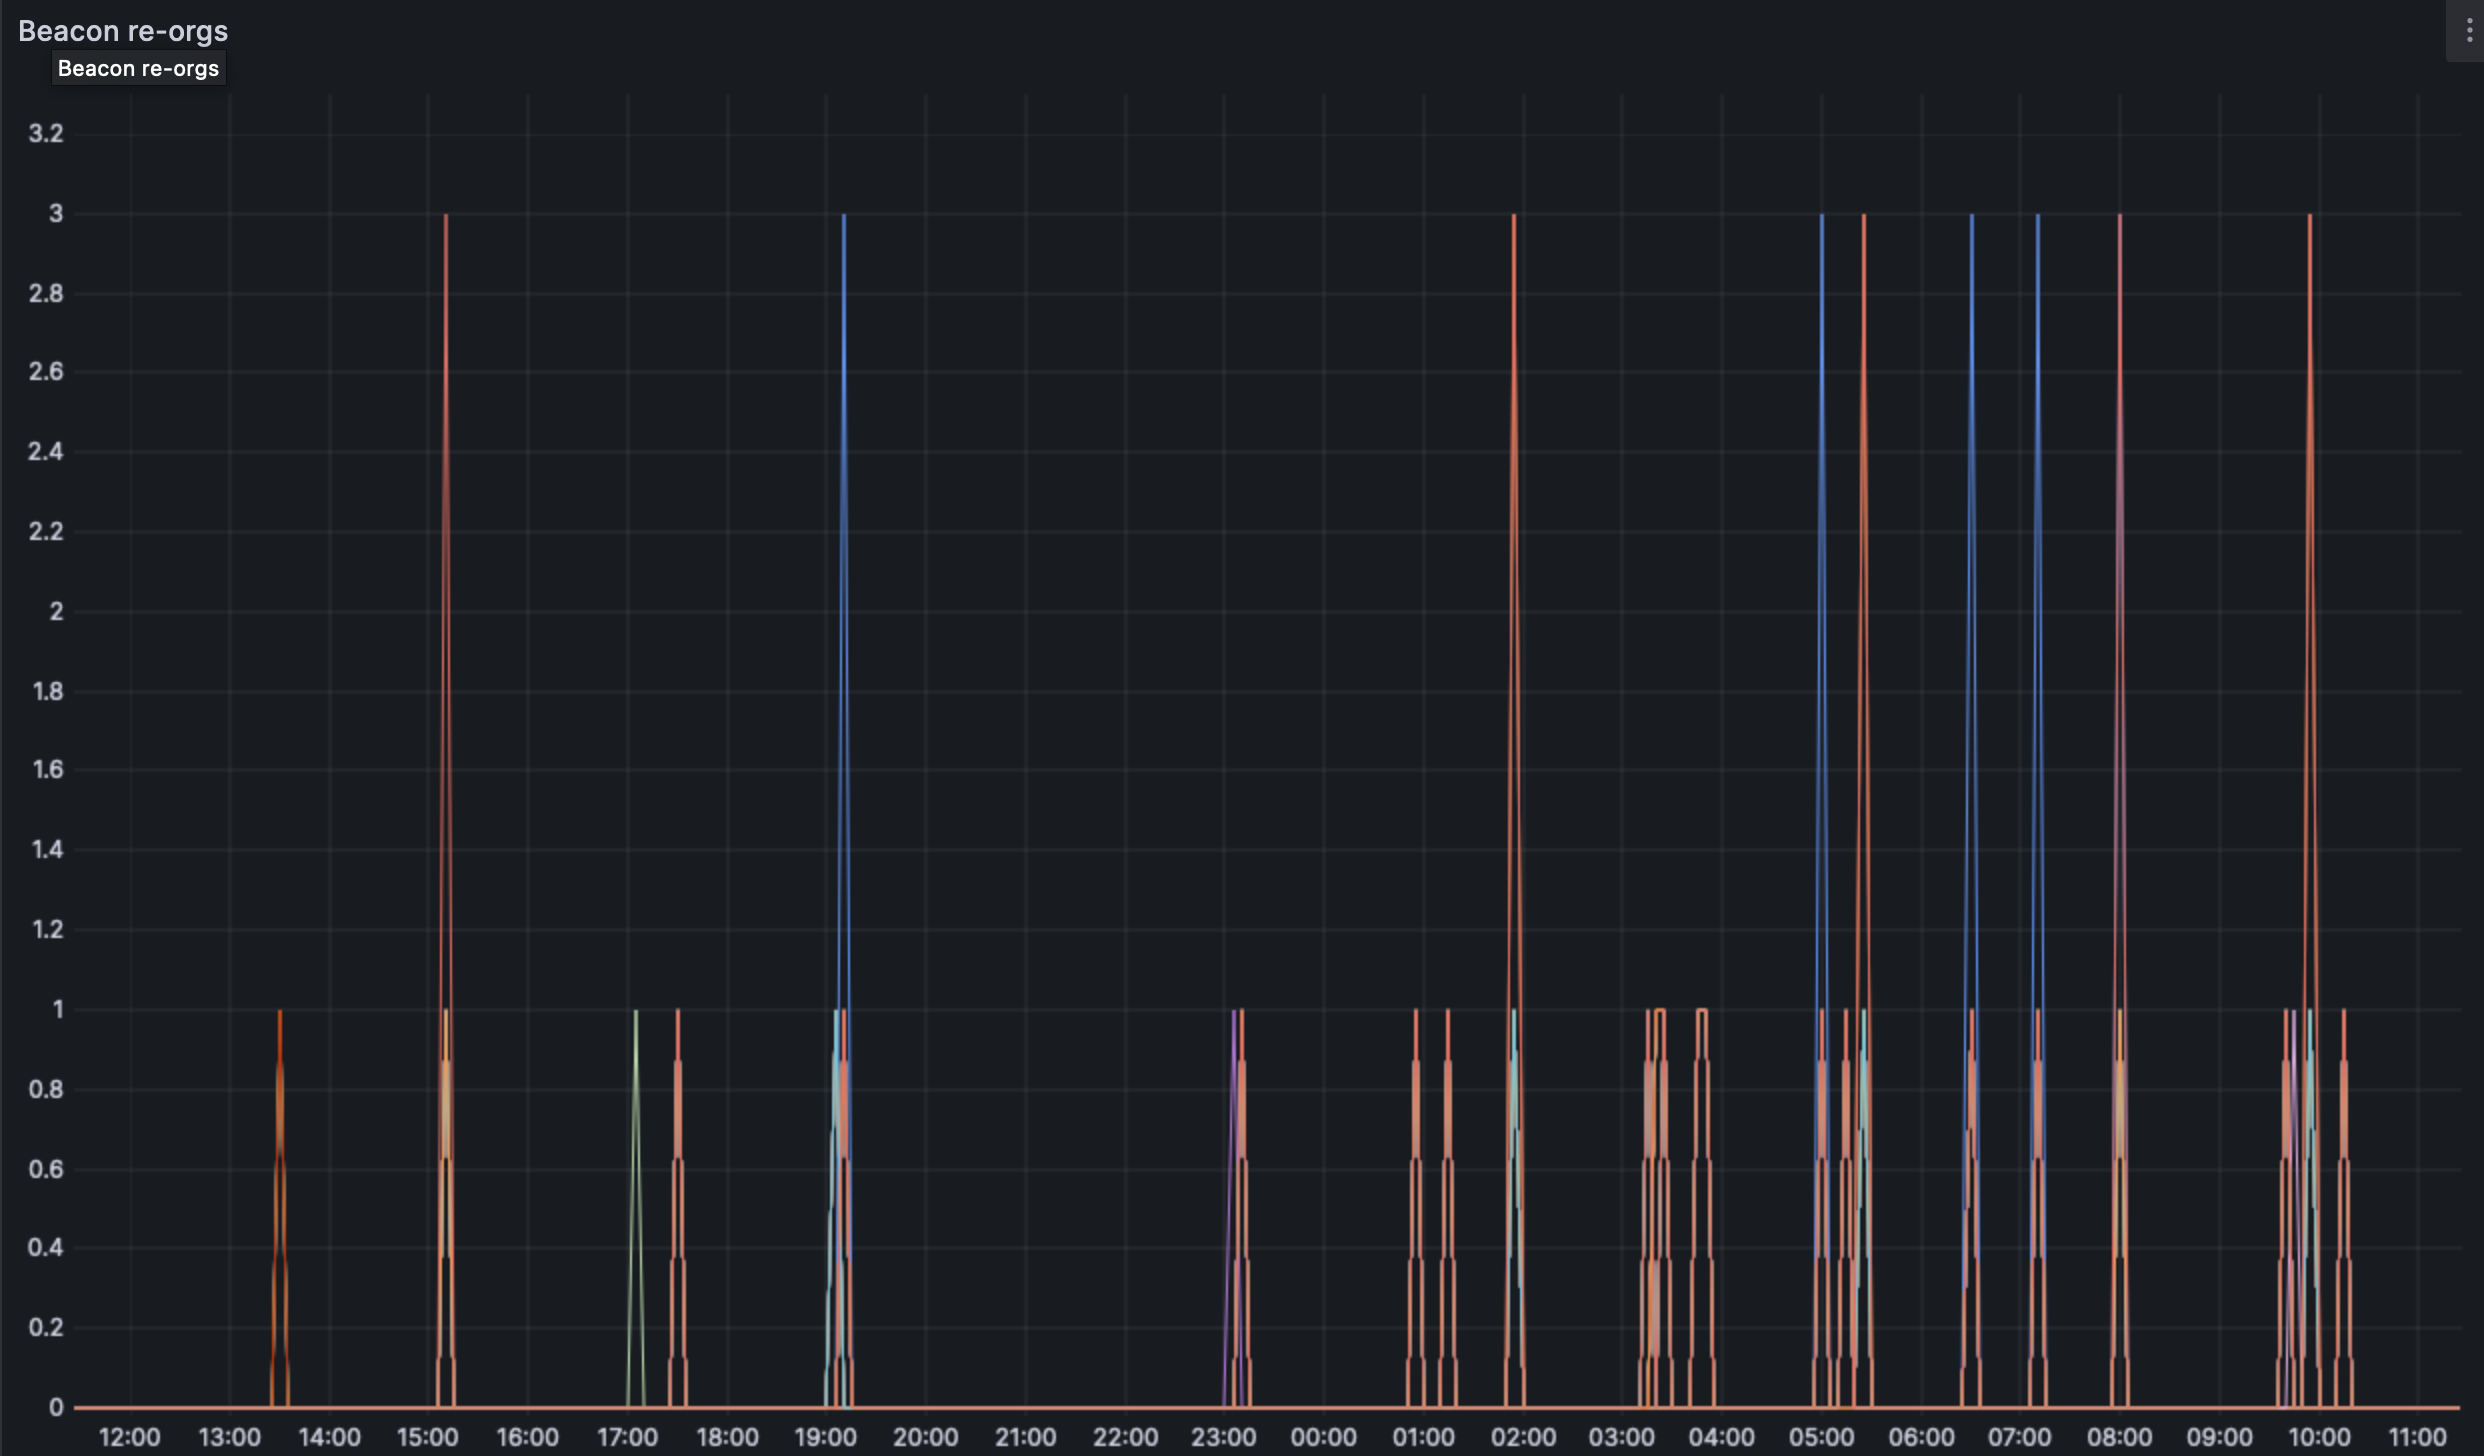
We do see some reorgs on the network, the deepest being of depth 3. We would need more analsysis or the use of forky to find the exact cause of the reorgs.
## Blob analysis
Blob data was collected with [Xatu](https://github.com/ethpandaops/xatu/) targeting the event stream of 3(each) teku, prysm and lighthouse nodes. These nodes were geographically distributed across the Germany and New York. Xatu was run on both x86 and ARM machines. More nodes will be added over the coming days once support for the event stream topic is widely achieved.
Over the span of ~24h, Xatu has ingested >75k slots/blocks and 227k blob sidecars. The graphs below are a visualization of the same.
**Note: The blob spammers currently are run at a rate to achieve between 1-4 blobs per slot. This is deemed close enough to the target that we should se optimal client performance. **
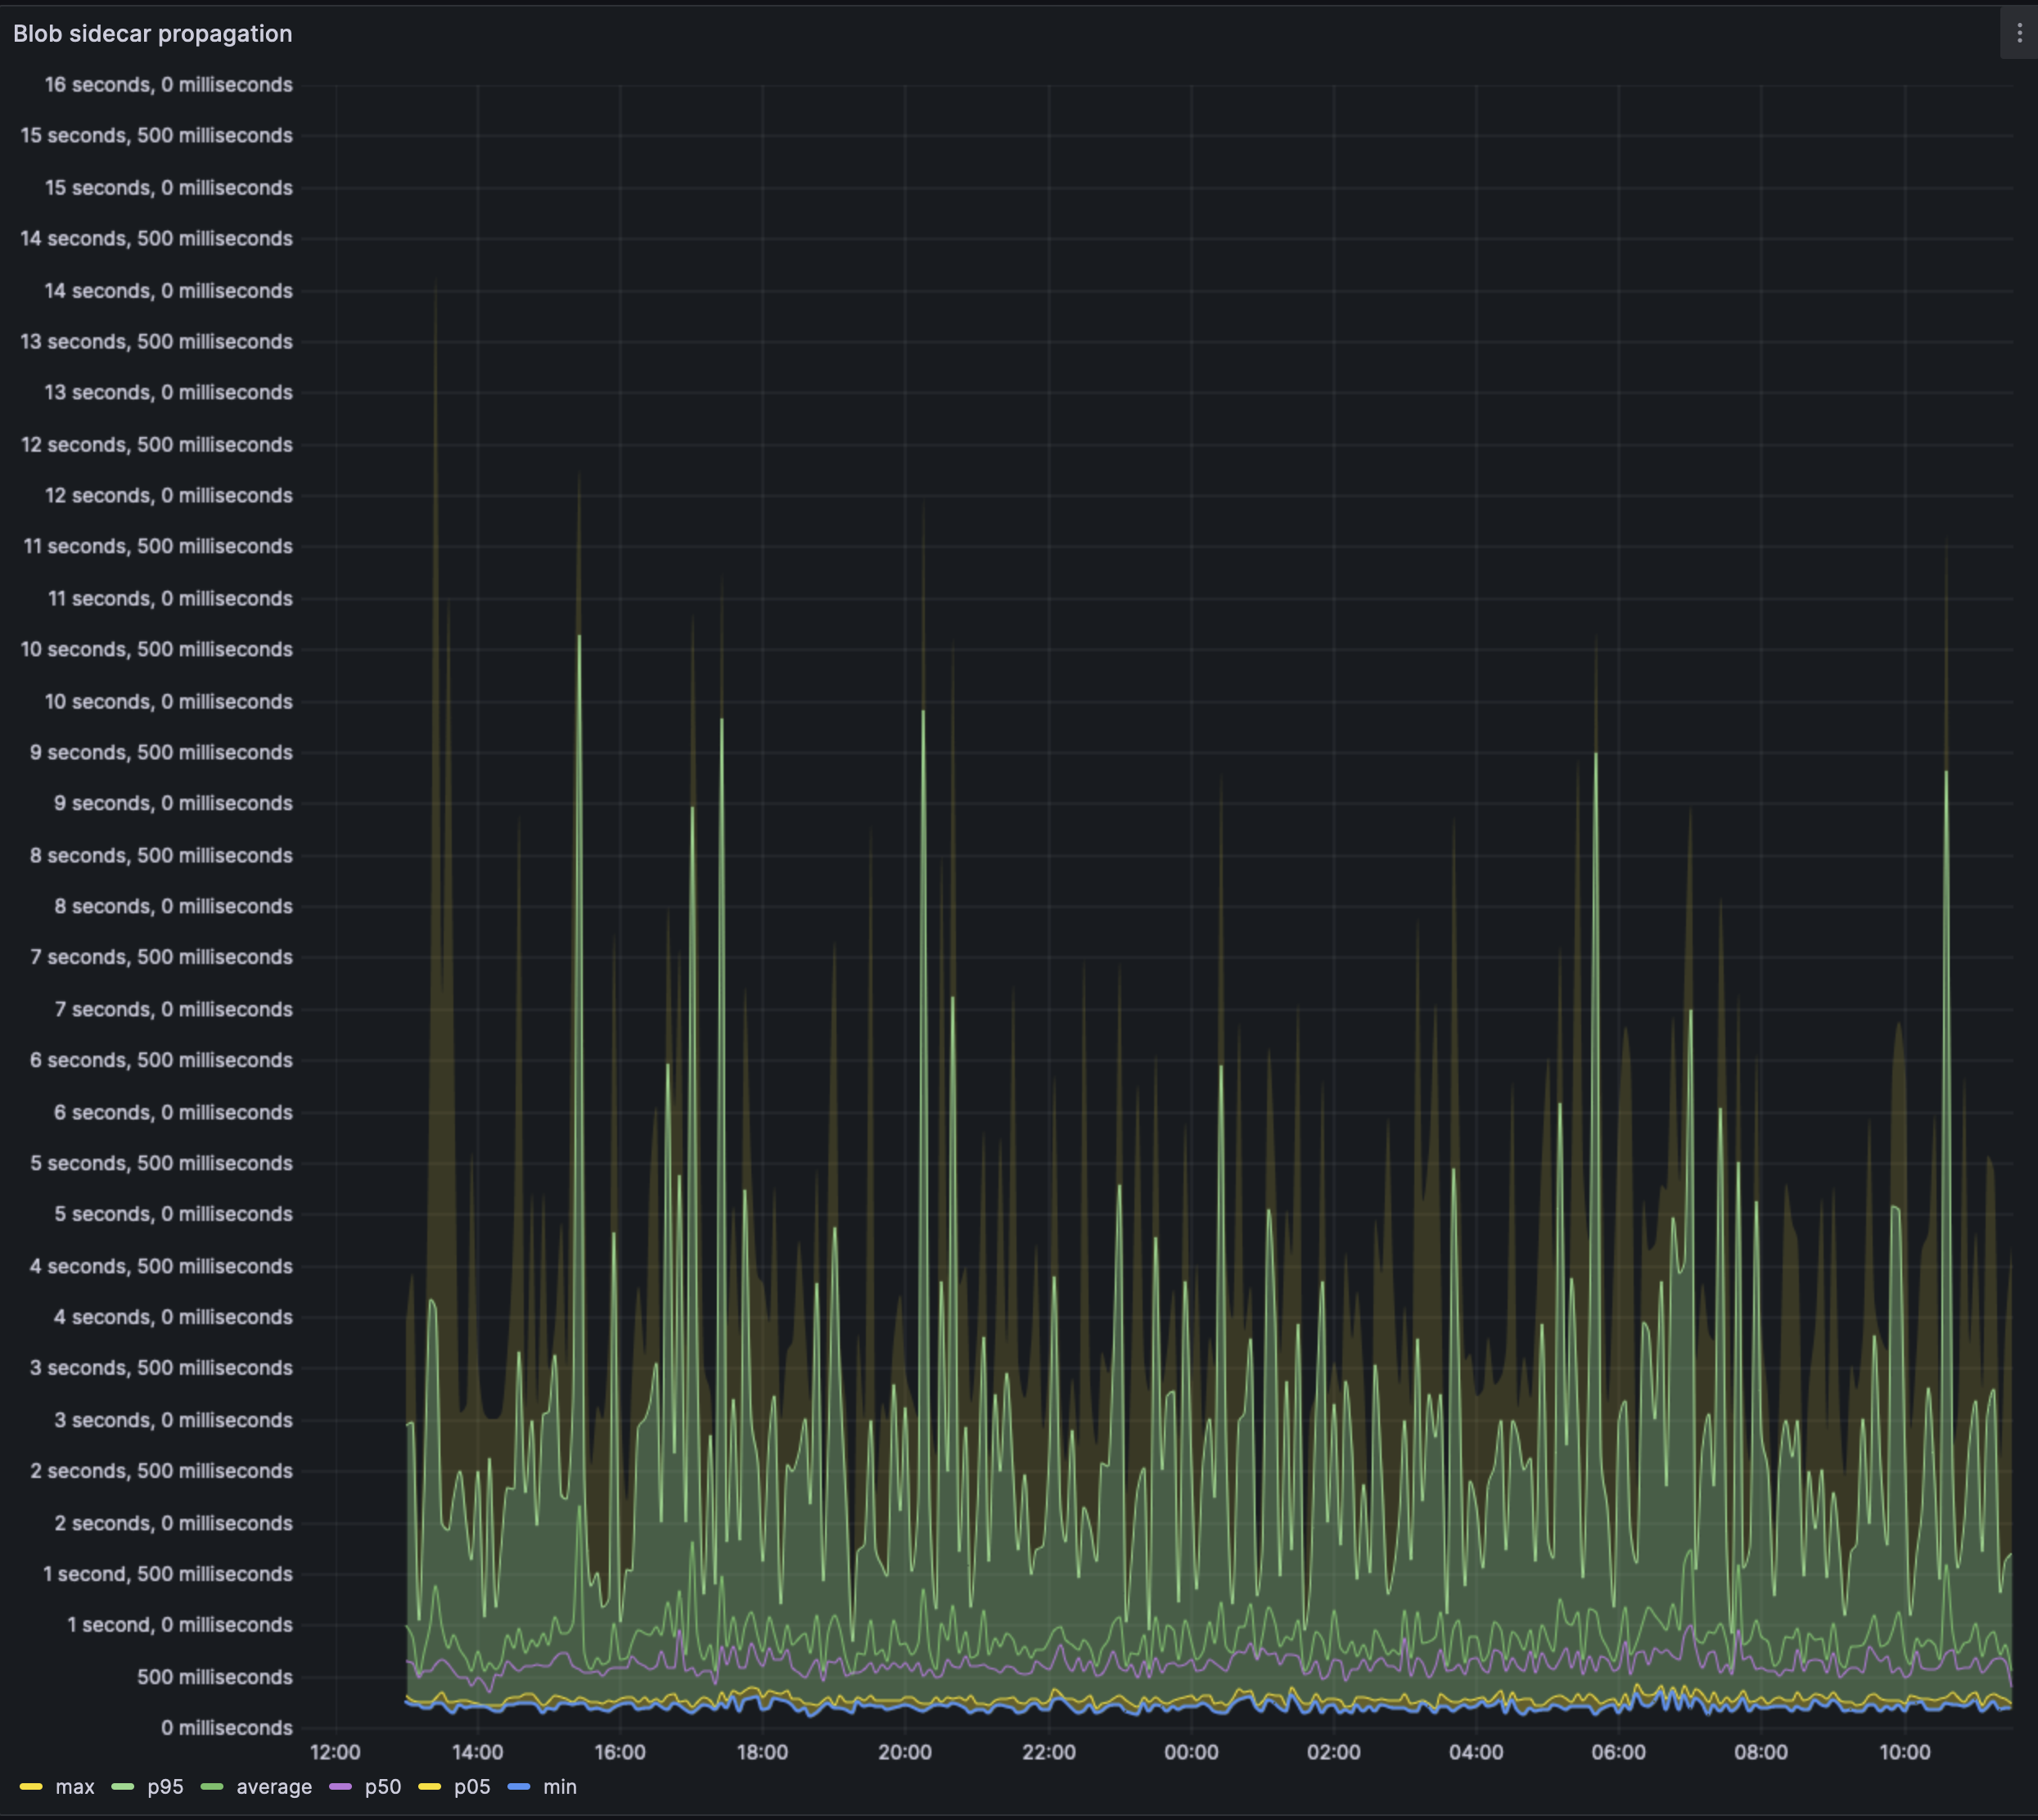
We can see that the average case blob is propagated through the network in well under 1s. Except for some outliers where blobs may take up to 3s on average to propagate. The average p95 across the 24h timeframe seems to be ~2.5s, i.e: 95% of the nodes saw the blob in under 2.5s.
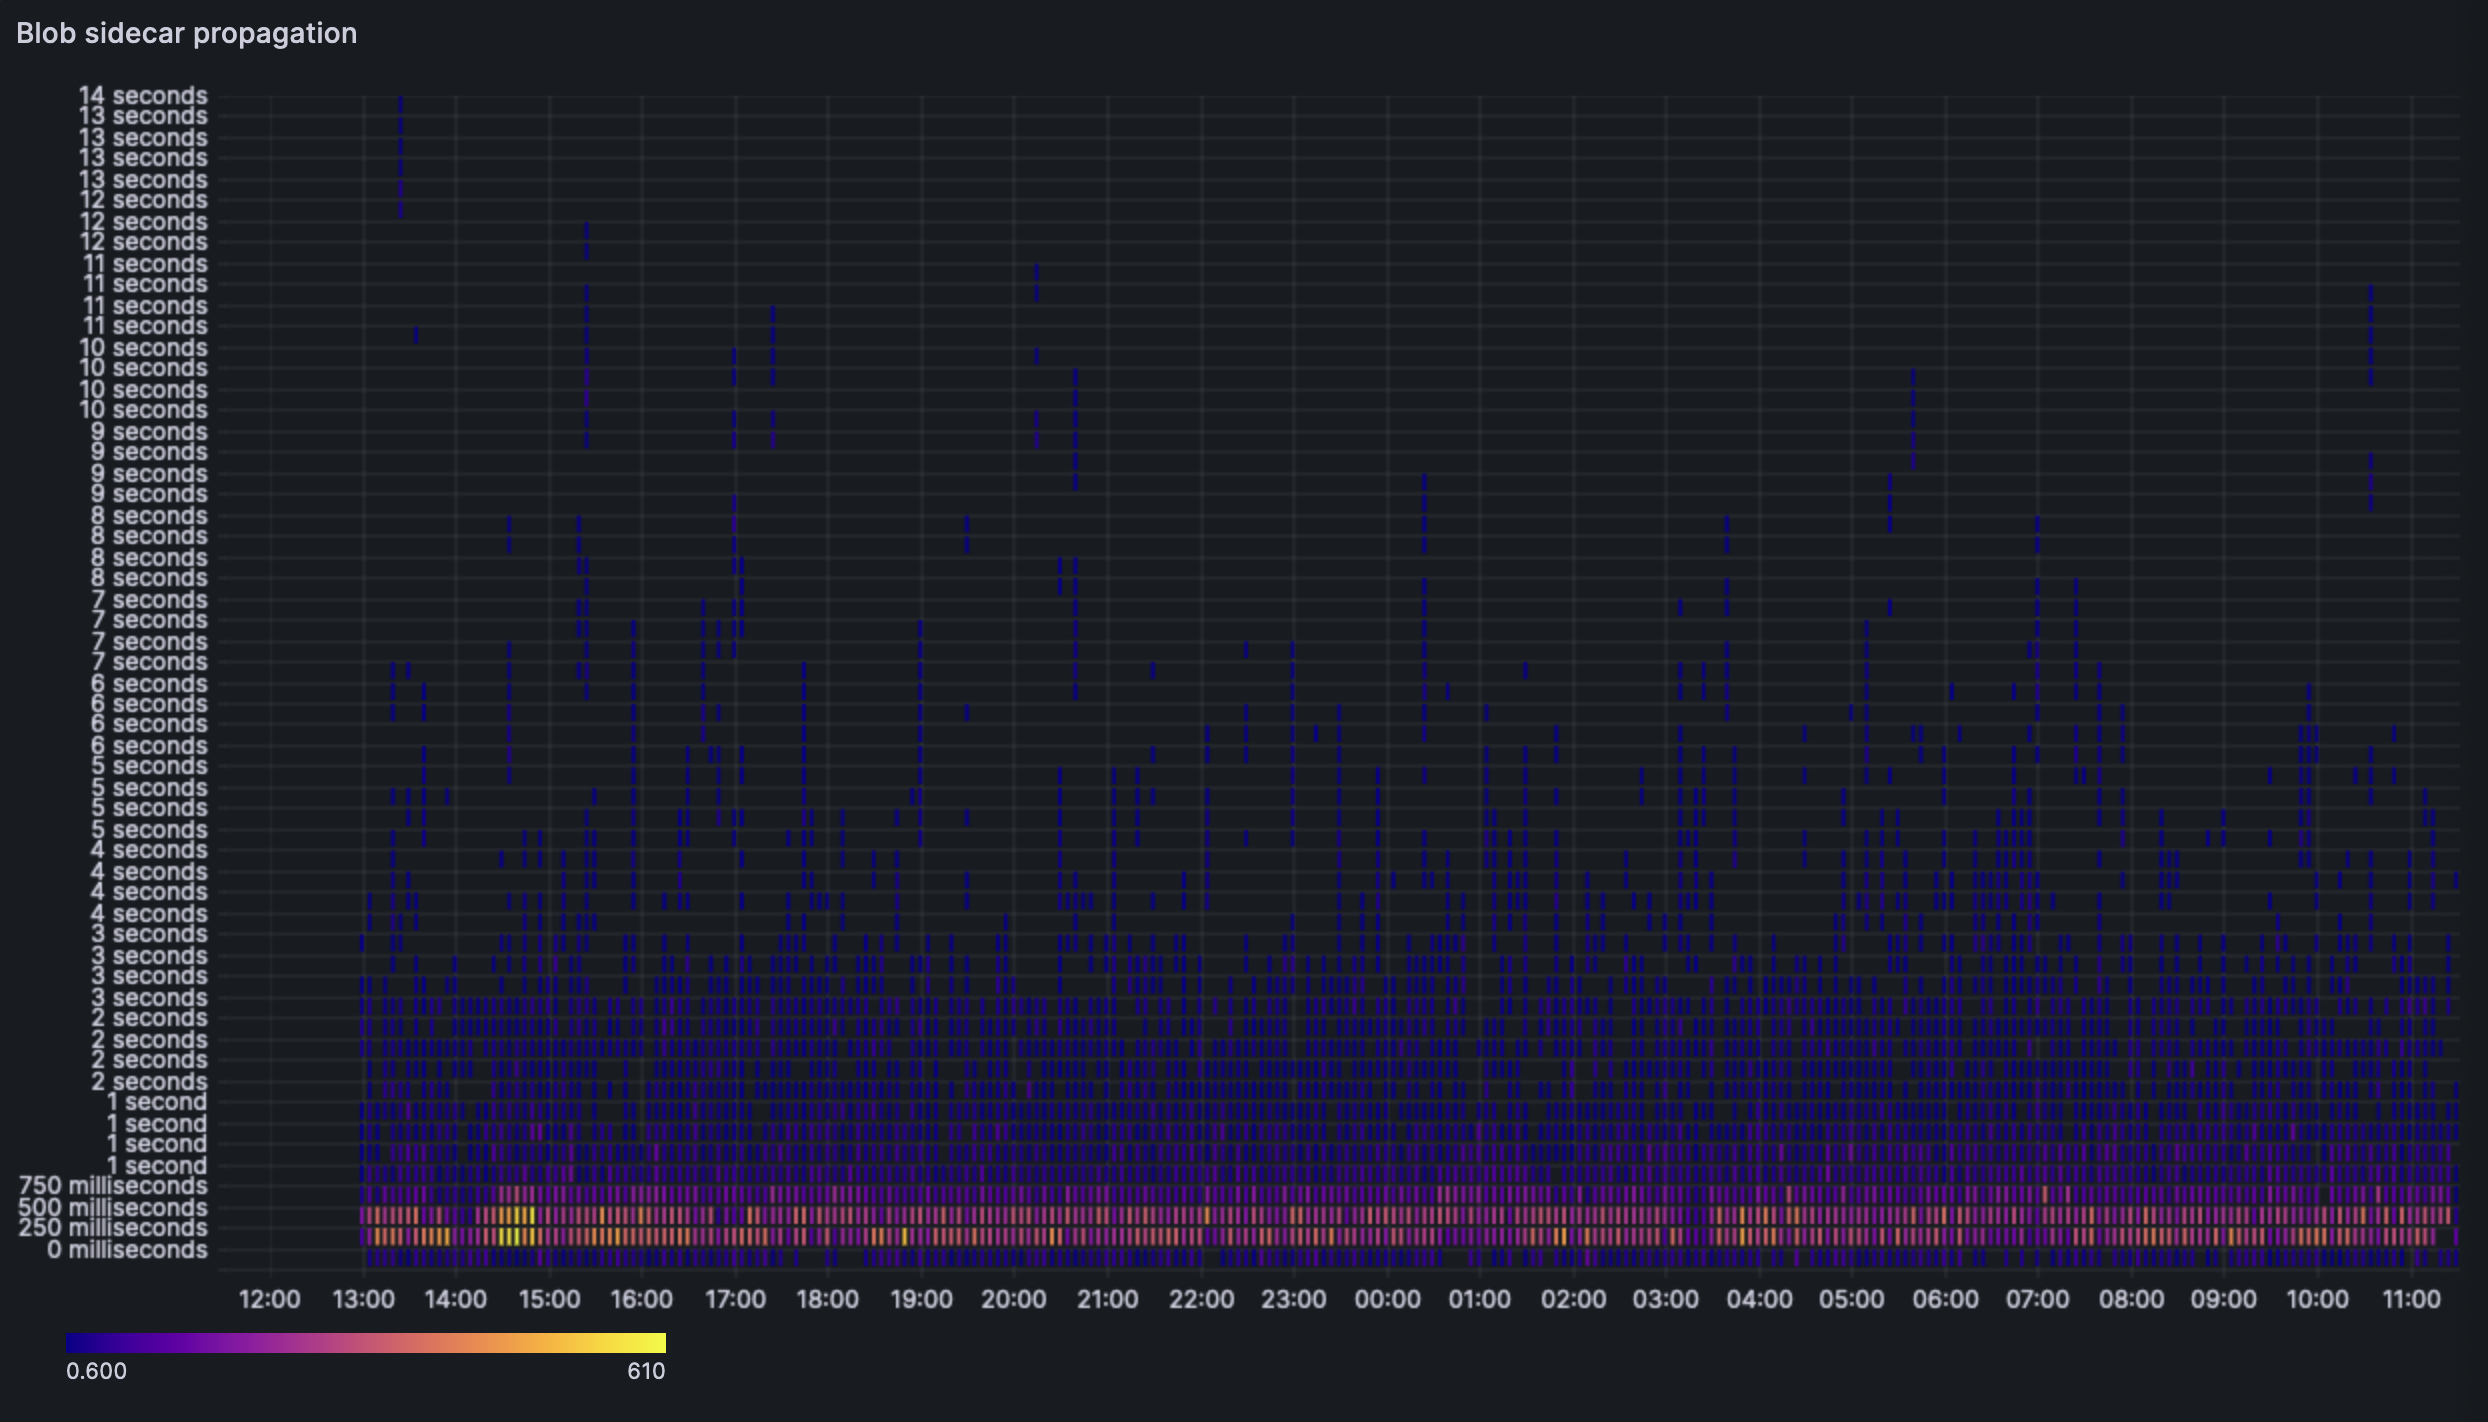
The heatmap shows us a similar story, most blob sidecars are received by every node between the 250ms and the 750ms mark.

This graph showcases the blob difference across our sentries. This graph is basically another representation of the first blob propagation. The average case, the blob is seen across sentries in under 1s.
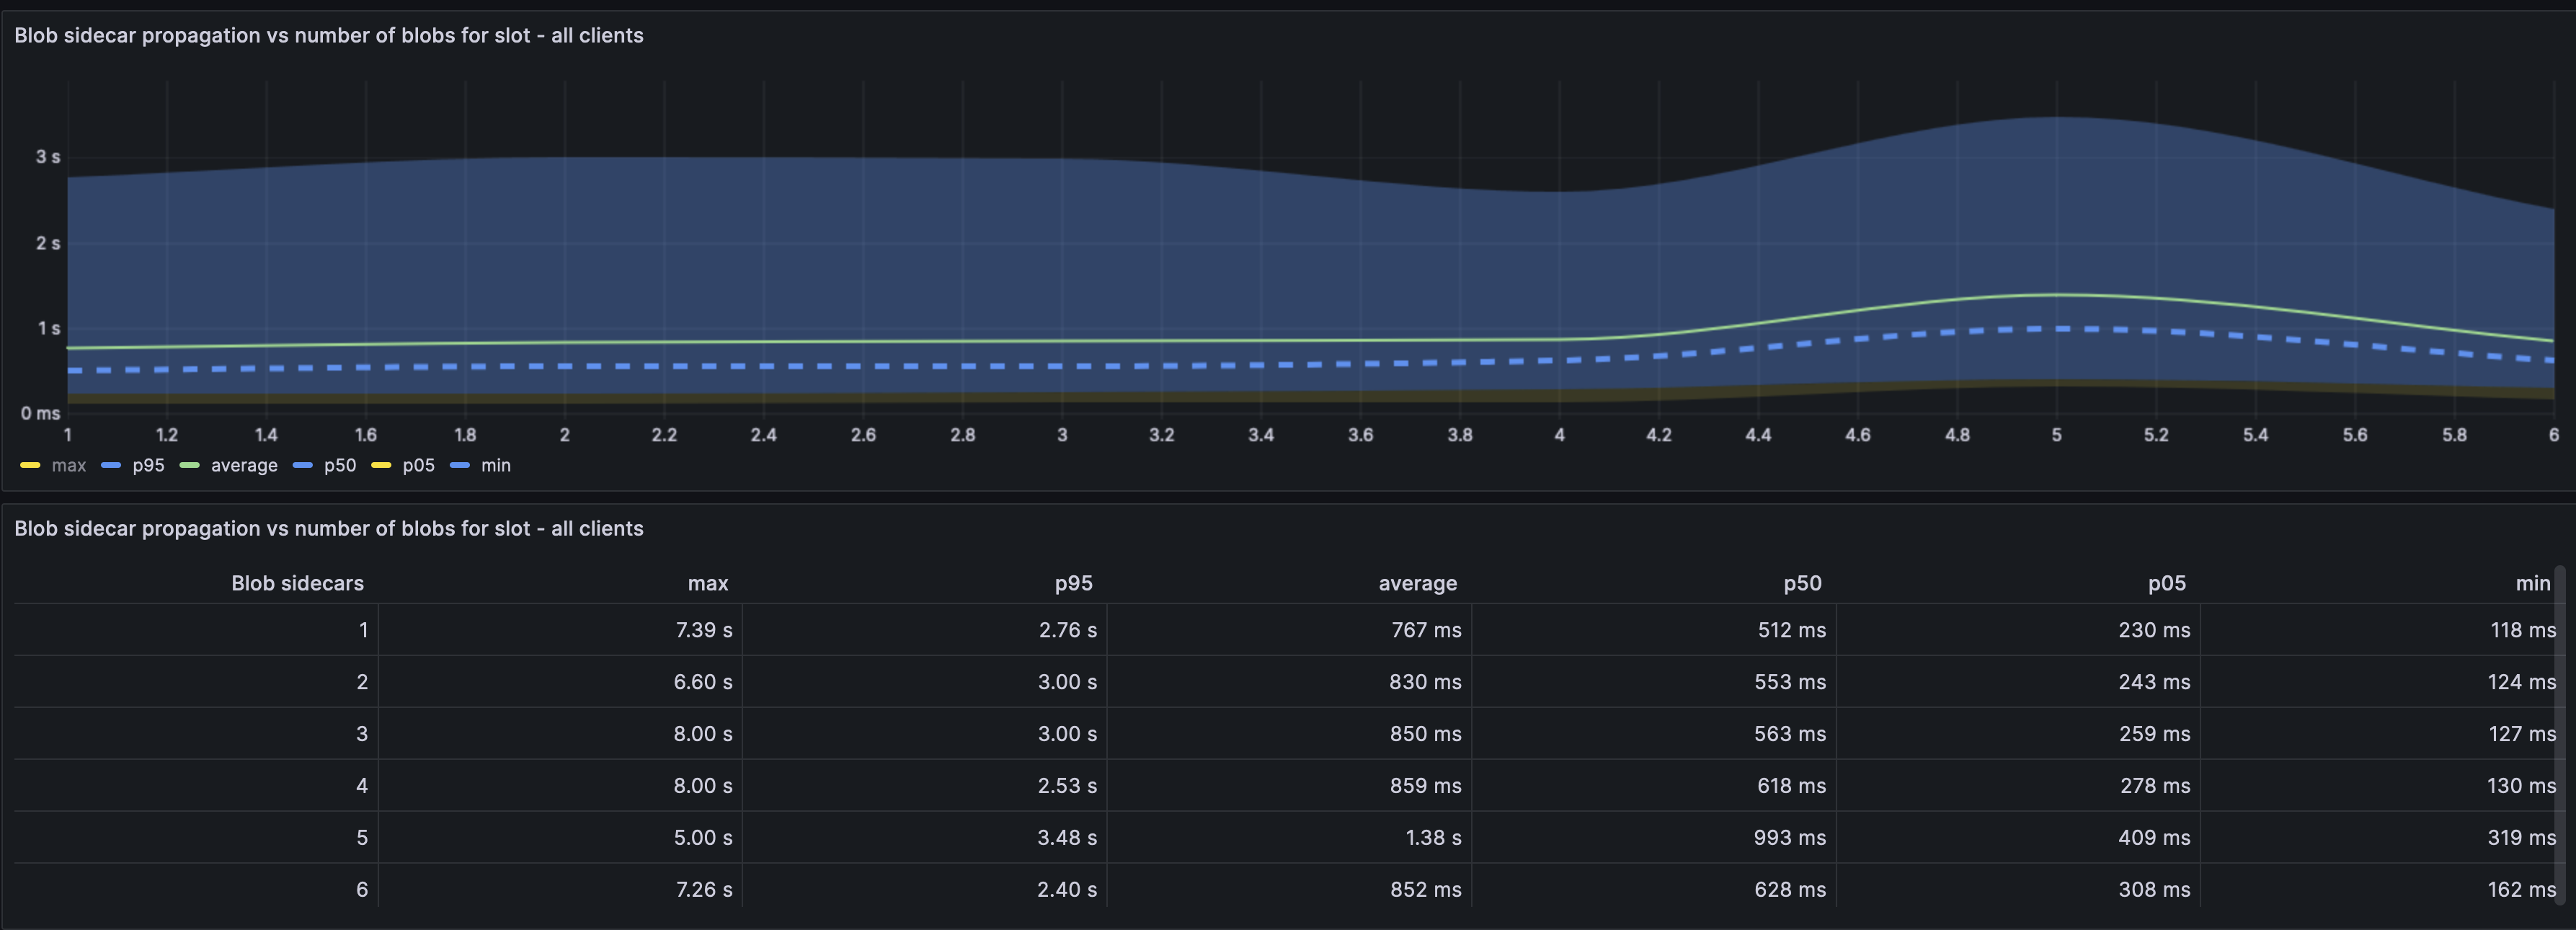
In this graph, we can see that the variance in the blob propagation time is quite independent of the number of blobs included in the slot (Across all clients). i.e: Time taken for propagation of 6 blobs is not vastly different from 1 blob irrespective of the number of blobs included in the slot.
Curiously, all clients seem to have an increased blob propagation time when there are 4->5 blobs (even more than 6).
Note: The per client distribution of the above graph can be found [here](https://grafana.observability.ethpandaops.io/d/be15cc56-e151-4268-8772-f4a9c6a4e246/blobs?orgId=1&from=now-24h&to=now). This could be useful for client optimisations.
## Block/Attestation propagation analysis


Block propagation times do not seem affected by the blob presence or the dencun fork. We are seeing the block propagation heatmap stay in a tight band around the 250ms -> 750ms range.
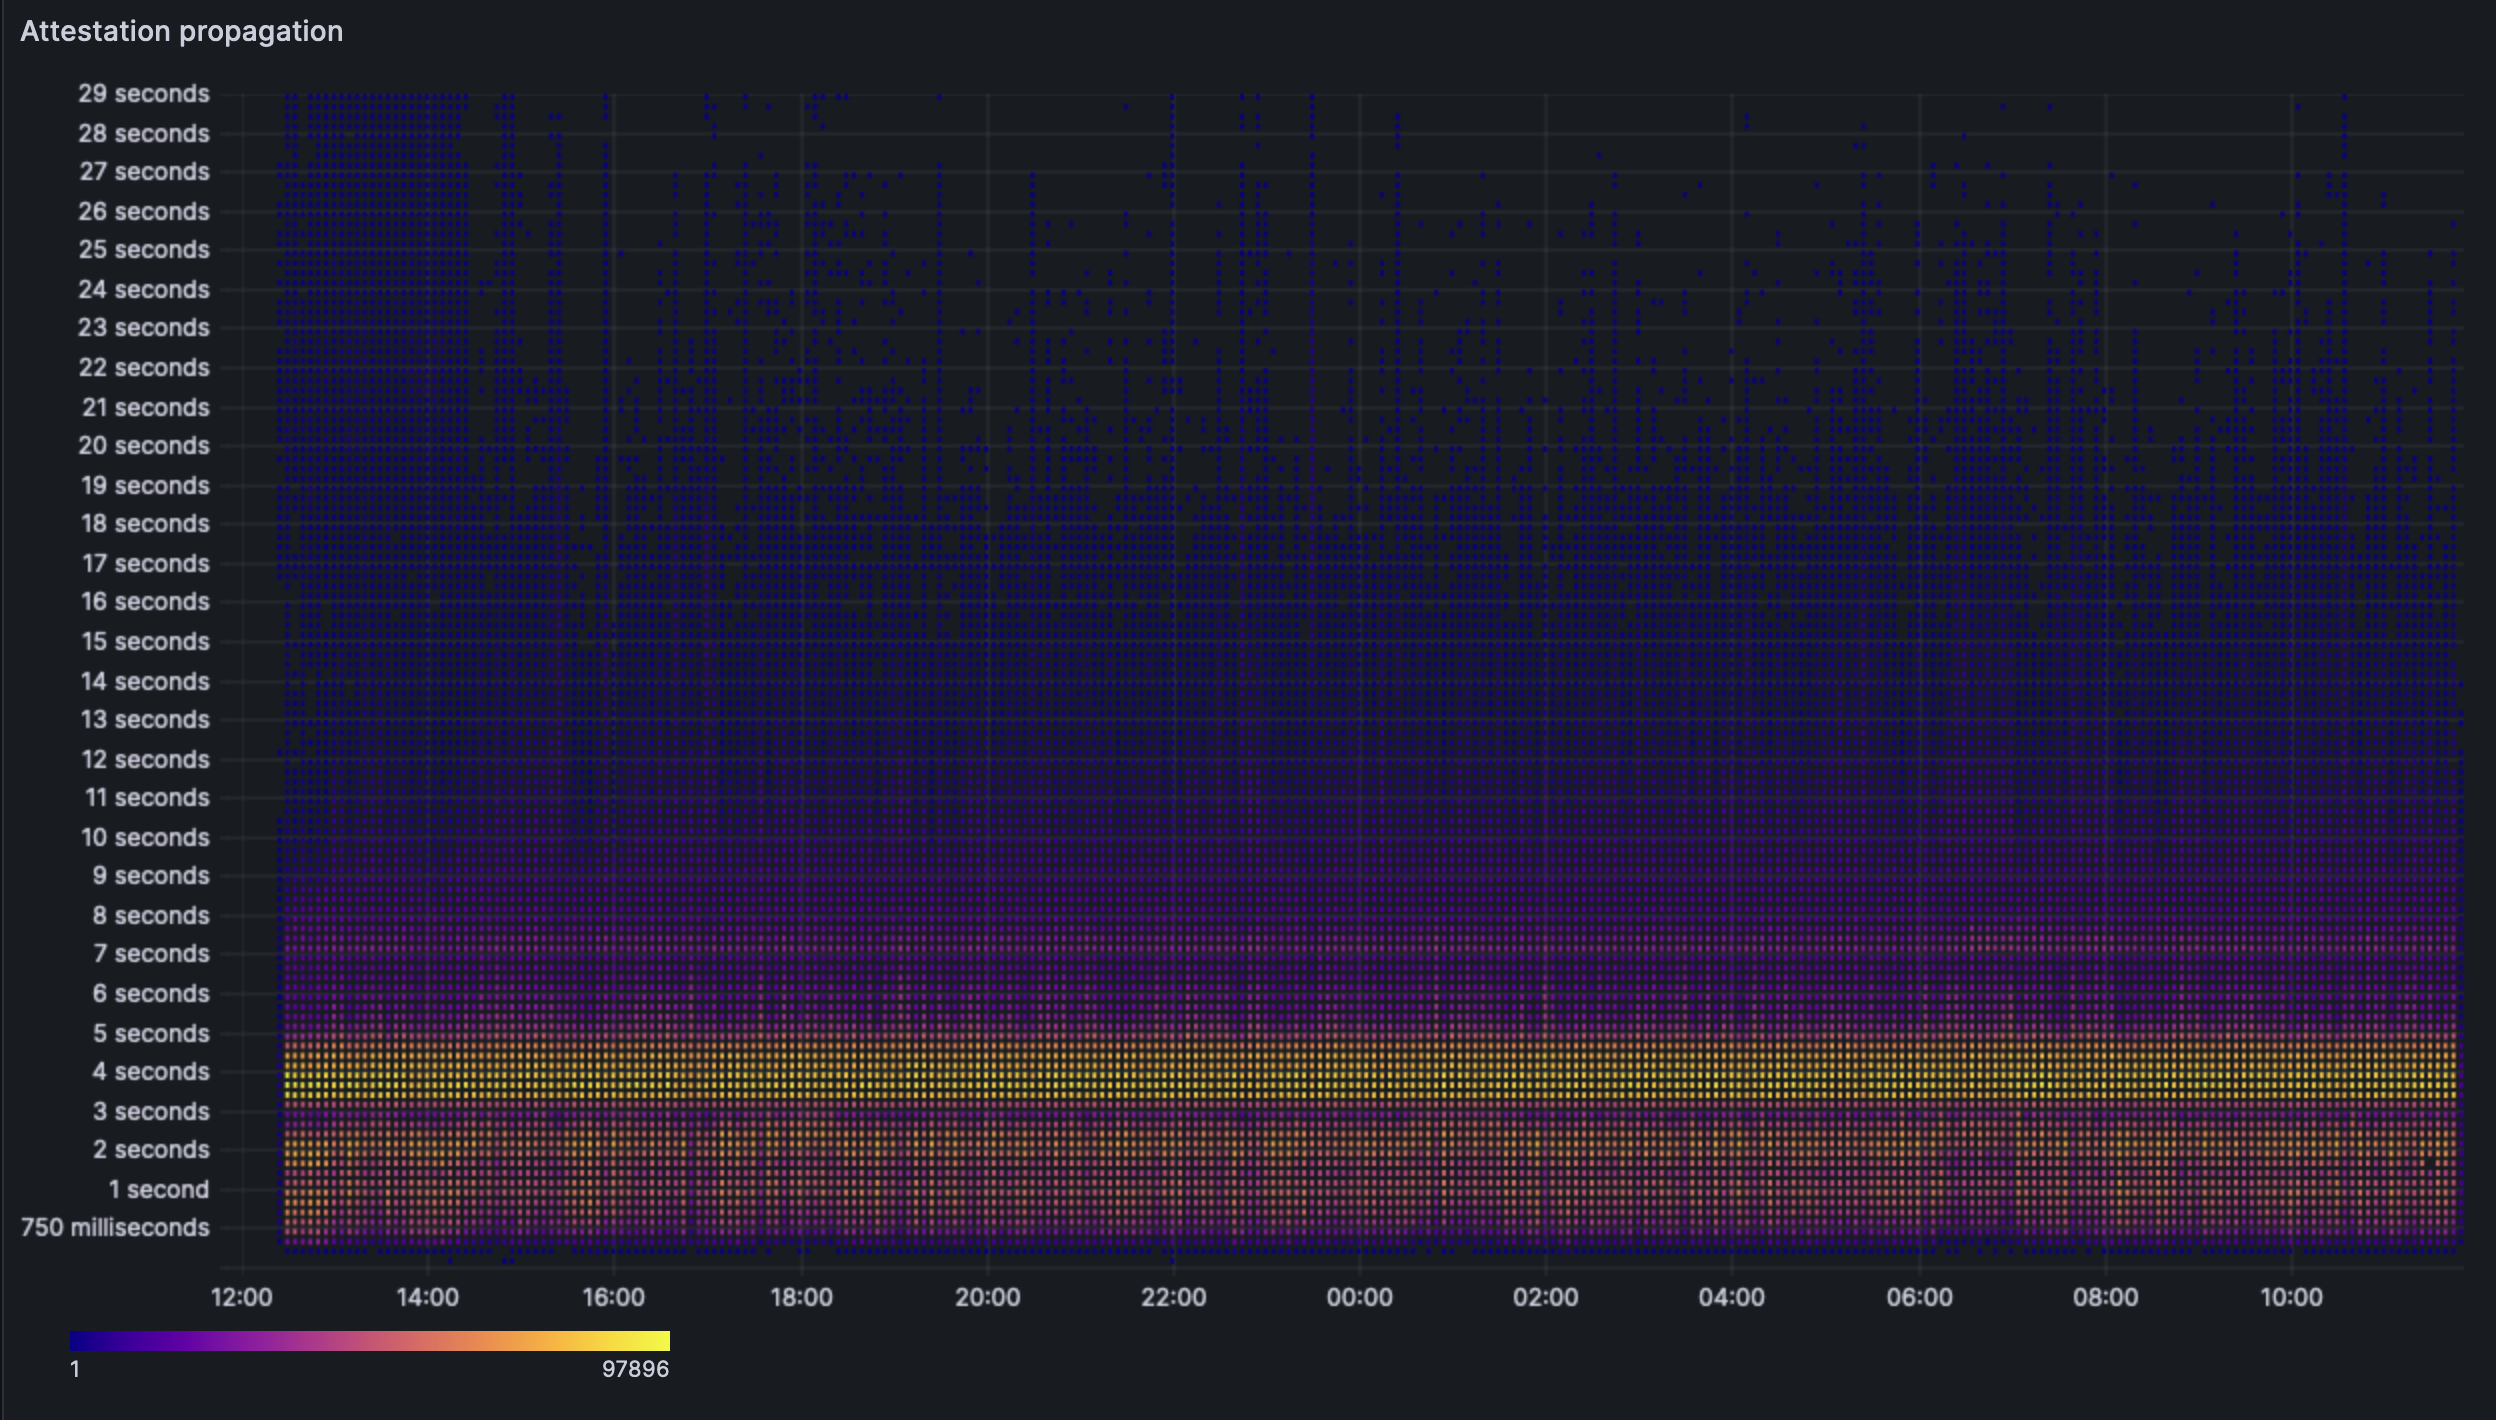
The attestation propagation heatmap also seems unchanged by the fork. We see that the clients indeed are able to perform their attestation duties in the given span of time.
## Block/Blob analysis
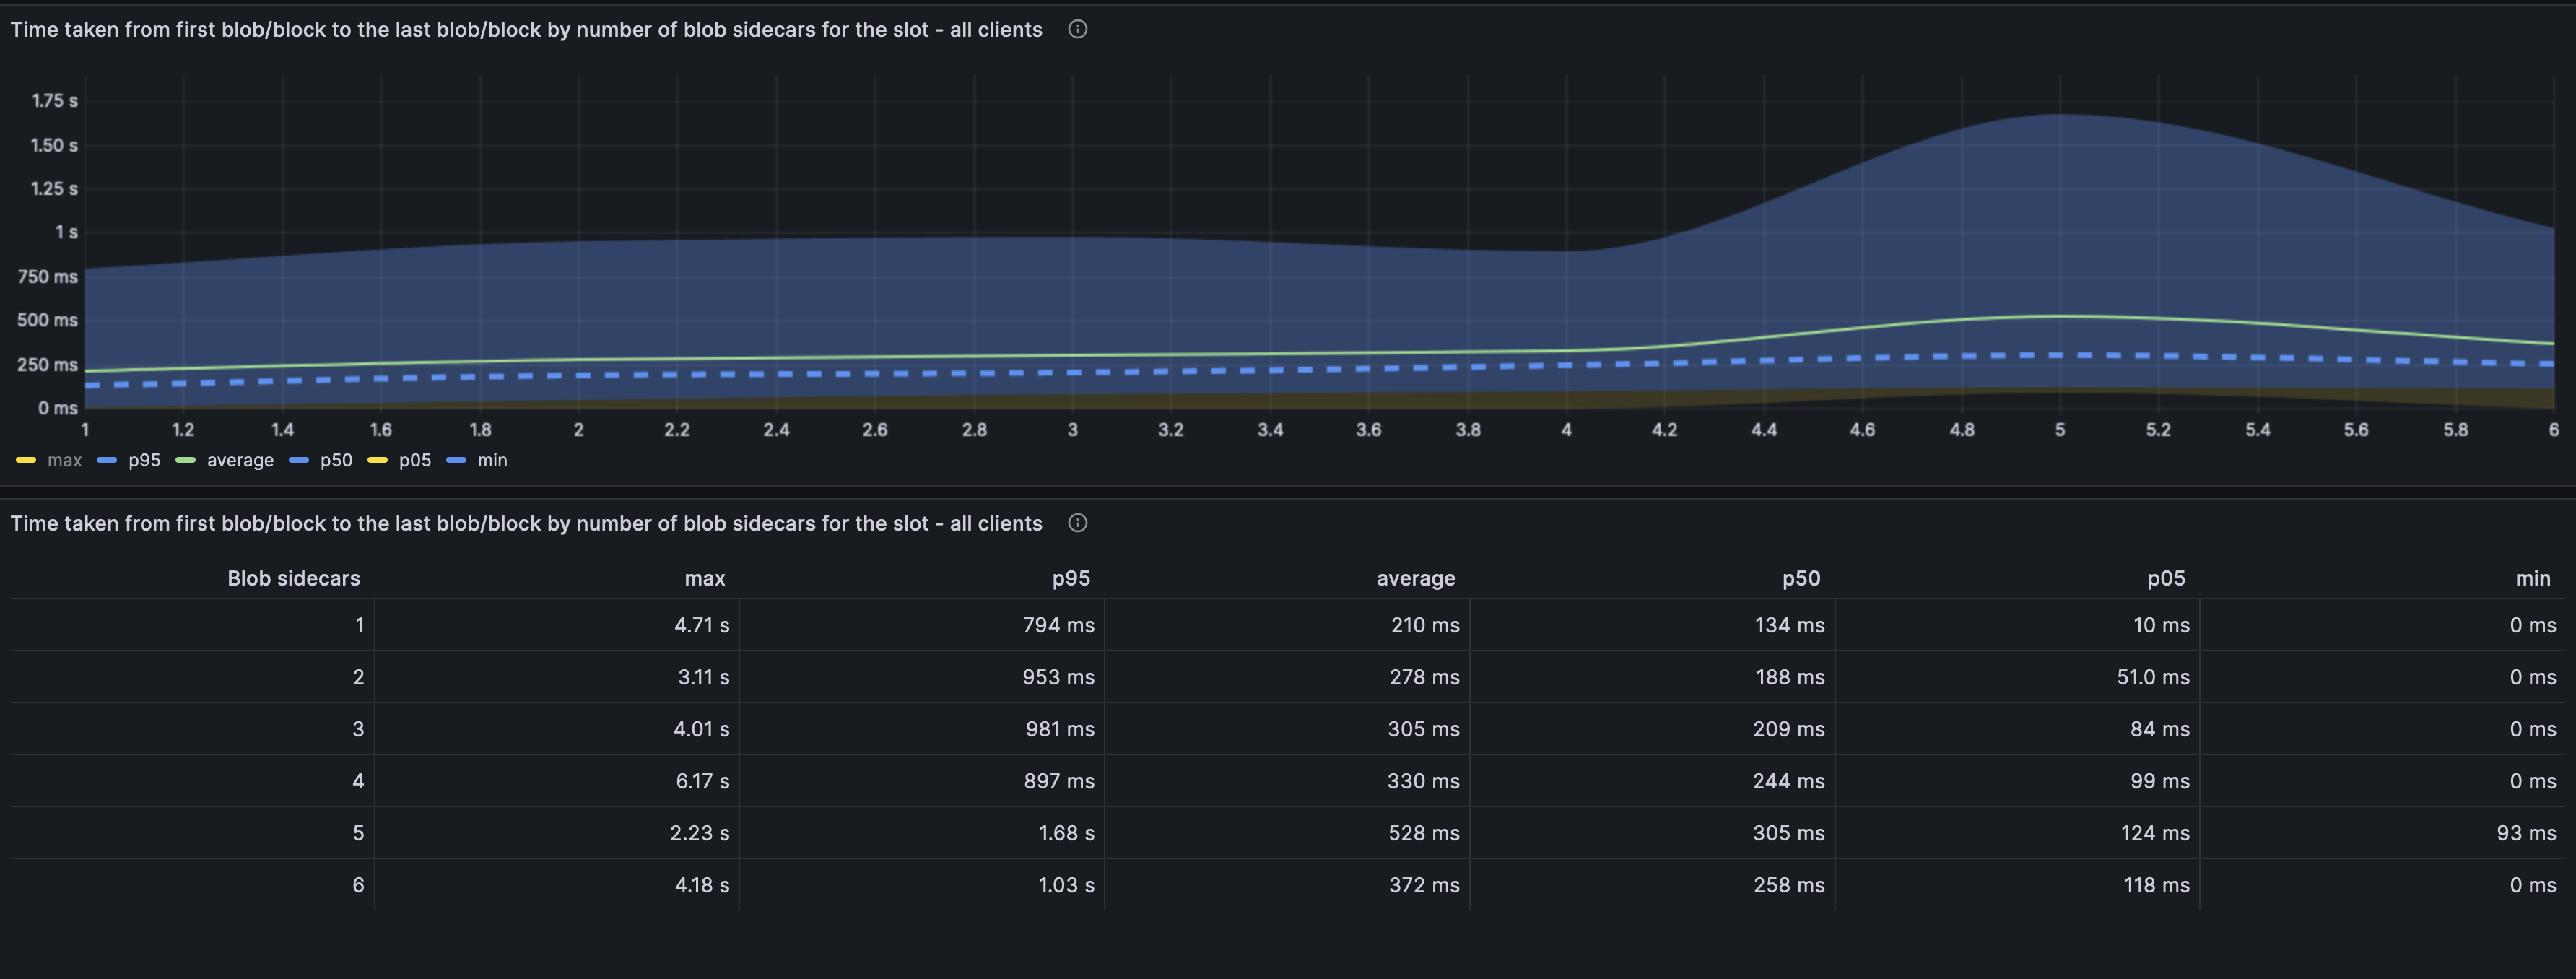
The above graph depicts the amount of time from the first blob included in a block till the last blob to be received by the sentry. This is an important metric as we need all the blobs in order to validate a block. A delay in the last blob implies we cannot verify the block even though we may have it.
We see a that the time does indeed increase as we increase the number of blobs. There is an unnatural increase between 4 and 5 blobs, which then reduces at 6. No current theory as to why.
The average worst case is when we see 5 blobs in a block. The time between the first and 5th blob is ~530ms with the p95 value being 1.68s. The max value seen was actually for 4 blobs and the value was 6.17s. For the purpose of this analysis, we should probably give most creedence to the p95 values over the max values.
Additionally these values all include the ARM machines and there seem to be no percievable difference between the blob performance on x86 and ARM.
### Blob performance per client pair
The individual graphs can be viewed [here](https://grafana.observability.ethpandaops.io/d/be15cc56-e151-4268-8772-f4a9c6a4e246/blobs?orgId=1&from=now-24h&to=now).
However, we ran a manual query with the database of our explorer, dora:
```
graffiti | block_count | with_blobs | blob_rate
-----------------------+-------------+------------+-----------
lighthouse/reth | 18 | 18 | 1.00
lighthouse/besu | 203 | 186 | 0.92
lighthouse/nethermind | 498 | 448 | 0.90
nimbus/besu | 214 | 193 | 0.90
prysm/nethermind | 521 | 467 | 0.90
teku/geth | 543 | 487 | 0.90
nimbus/geth | 525 | 469 | 0.89
lighthouse/geth | 536 | 470 | 0.88
teku/nethermind | 527 | 464 | 0.88
prysm/geth | 521 | 460 | 0.88
nimbus/nethermind | 541 | 467 | 0.86
prysm/besu | 184 | 156 | 0.85
teku/besu | 223 | 189 | 0.85
lodestar/geth | 291 | 243 | 0.84
lodestar/besu | 168 | 140 | 0.83
lighthouse/erigon | 216 | 168 | 0.78
lodestar/erigon | 58 | 29 | 0.50
prysm/erigon | 221 | 81 | 0.37
teku/erigon | 209 | 78 | 0.37
nimbus/erigon | 222 | 66 | 0.30
nimbus/ethereumjs | 6 | 1 | 0.17
lodestar/ethereumjs | 2 | 0 | 0.00
lighthouse/ethereumjs | 2 | 0 | 0.00
(23 rows)
```
All mainnet clients have proposed multiple blocks with blobs, this indicates that the fundamental functionality works as expected. There seems to be a noticeable lack of blobs in blocks proposed by some erigon nodes as oposed to the other ELs. There should be some further analsysis conducted to optimize the clients. EthereumJS results are ommited as there are performance bottlenecks on the client.
## Churn limit test
In order to test the churn limit, we have started the network with 330+k genesis validators and performed deposits during the pre-dencun phase. These deposits were onboarded at a rate of 5 per epoch. After the dencun fork, we saw the churn limit move back down to the set value of 4. This was achieved by setting the value `MAX_PER_EPOCH_ACTIVATION_CHURN_LIMIT: 4` in the CL `config.yaml` files.
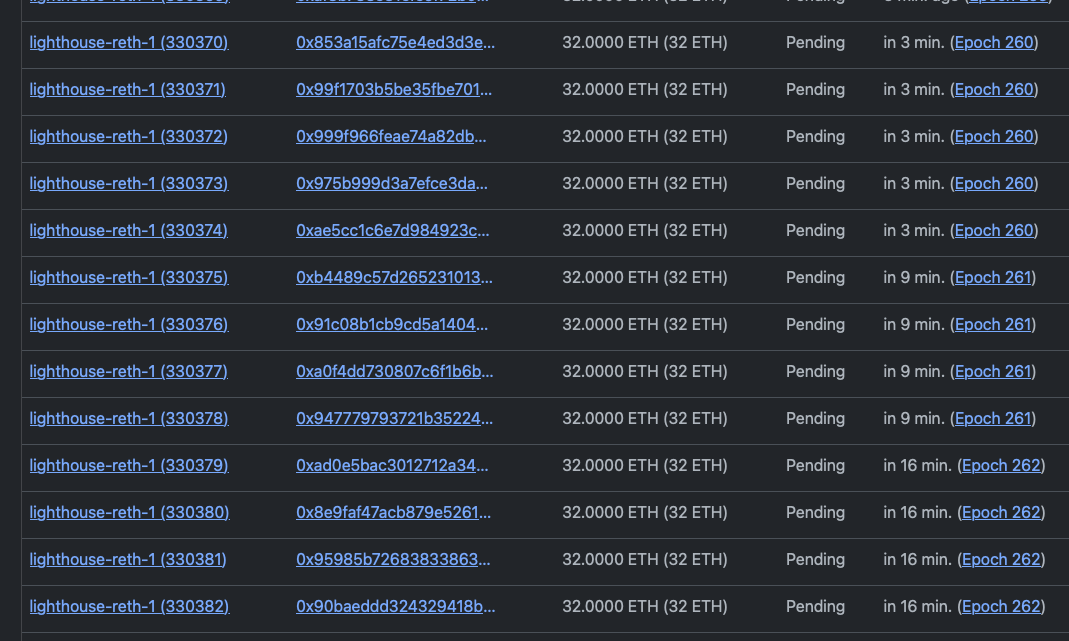
This screenshot shows that epoch 260 has 5 validators added but epoch 261 has only 4 validators added (churn limit).