# dencun-devnet-10 latency test
Dencun-devnet-10 baseline metrics can be found [here](https://notes.ethereum.org/@ethpandaops/dencun-devnet-10-analysis). Once we collected ~1 day worth of data with 1-4 blobs being mostly propagated, we started the spammer. This led to most slots containing 6 blobs and would represent a stressed network. The analysis of the stressed scenario can be found [here](https://notes.ethereum.org/@ethpandaops/devnet-10-stress-analsysis).
The invalid gossip of the blobber was stopped. The mode was switched to latency inducing. We initially added a latency of 1.5s to ~10% of blobs proposed by validators before gossip. We then upped this number to 2s.
The network has been running with 10% of blobs gossiped with a delay of 2s.
## Node split
Unchanged from baseline.
## Resource usage
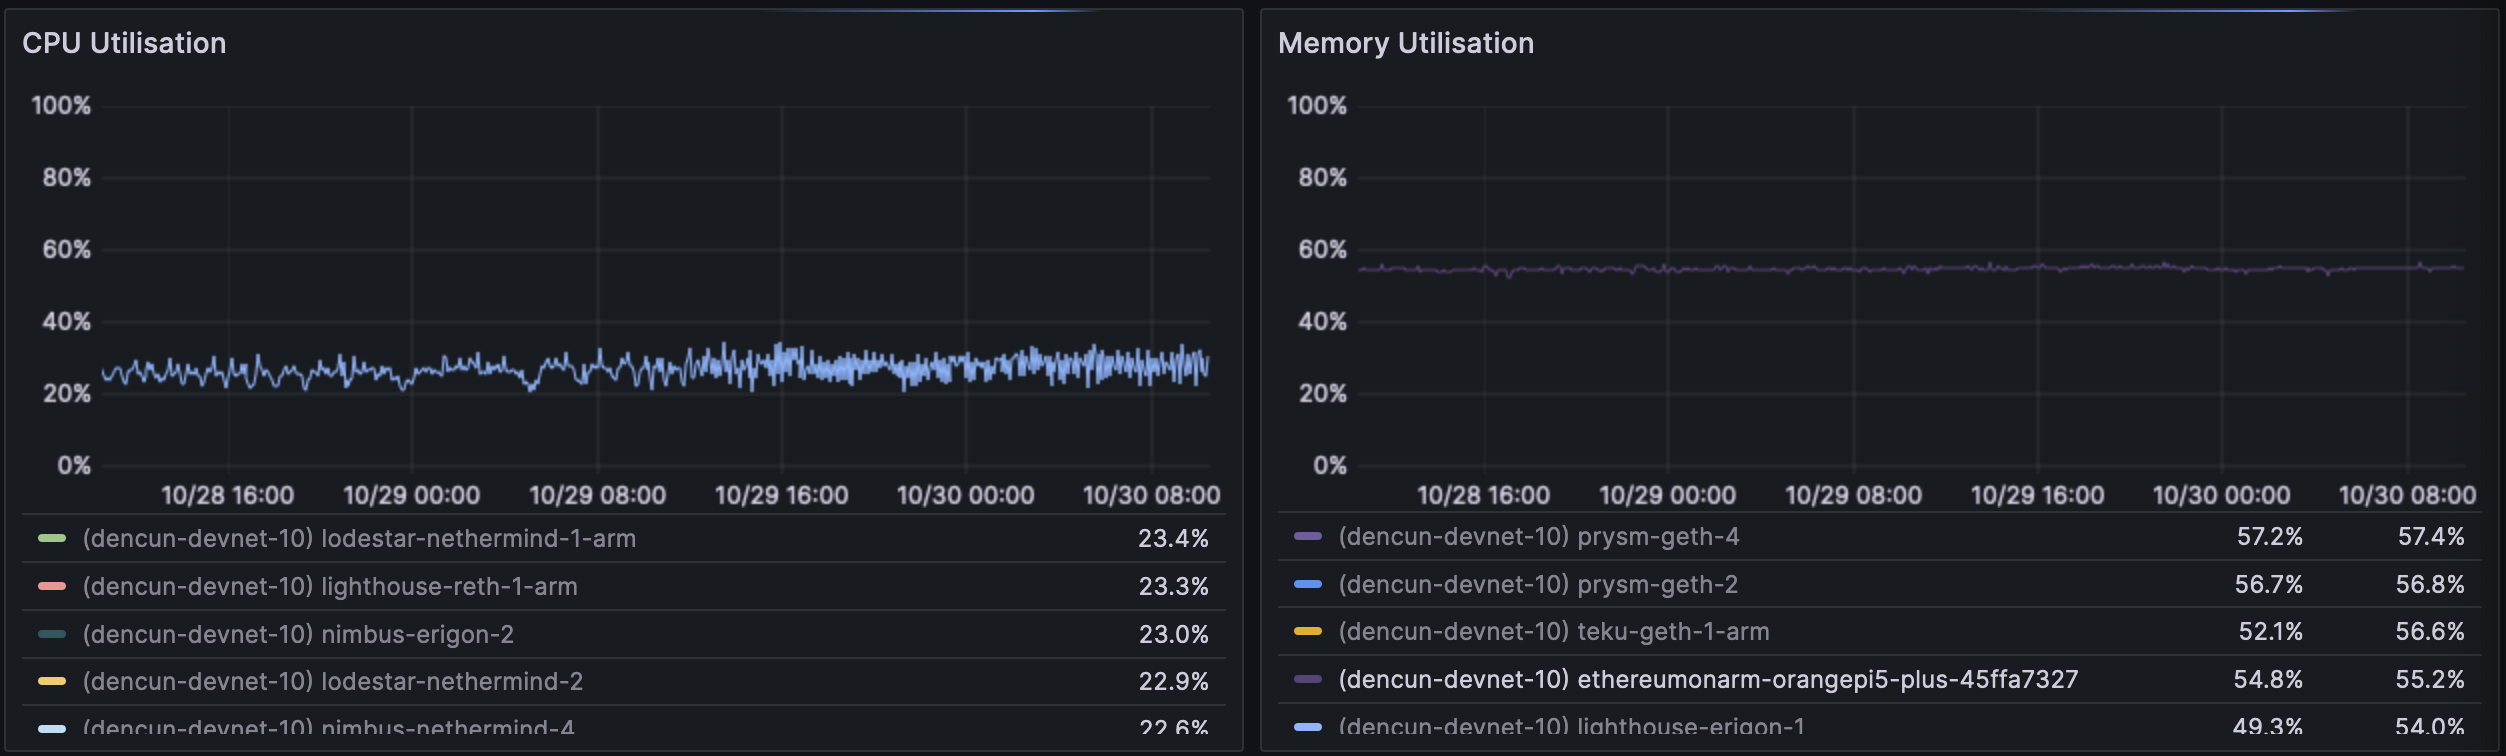
No percieved change in CPU or RAM usage compared to the stress test scenario. We had to restart a few nodes with different flags to enable the MEV workflow, that led to a drop in RAM use - but that's expected.
The EthereumOnARM team added a node and forwarded their data to our metrics server to compare with our own nodes. The orangepi-5 plus uses ~40% CPU and 60% RAM which is in line with our own ARM machines. This is a great data point to have for future tests.
### Geth/Erigon network use:
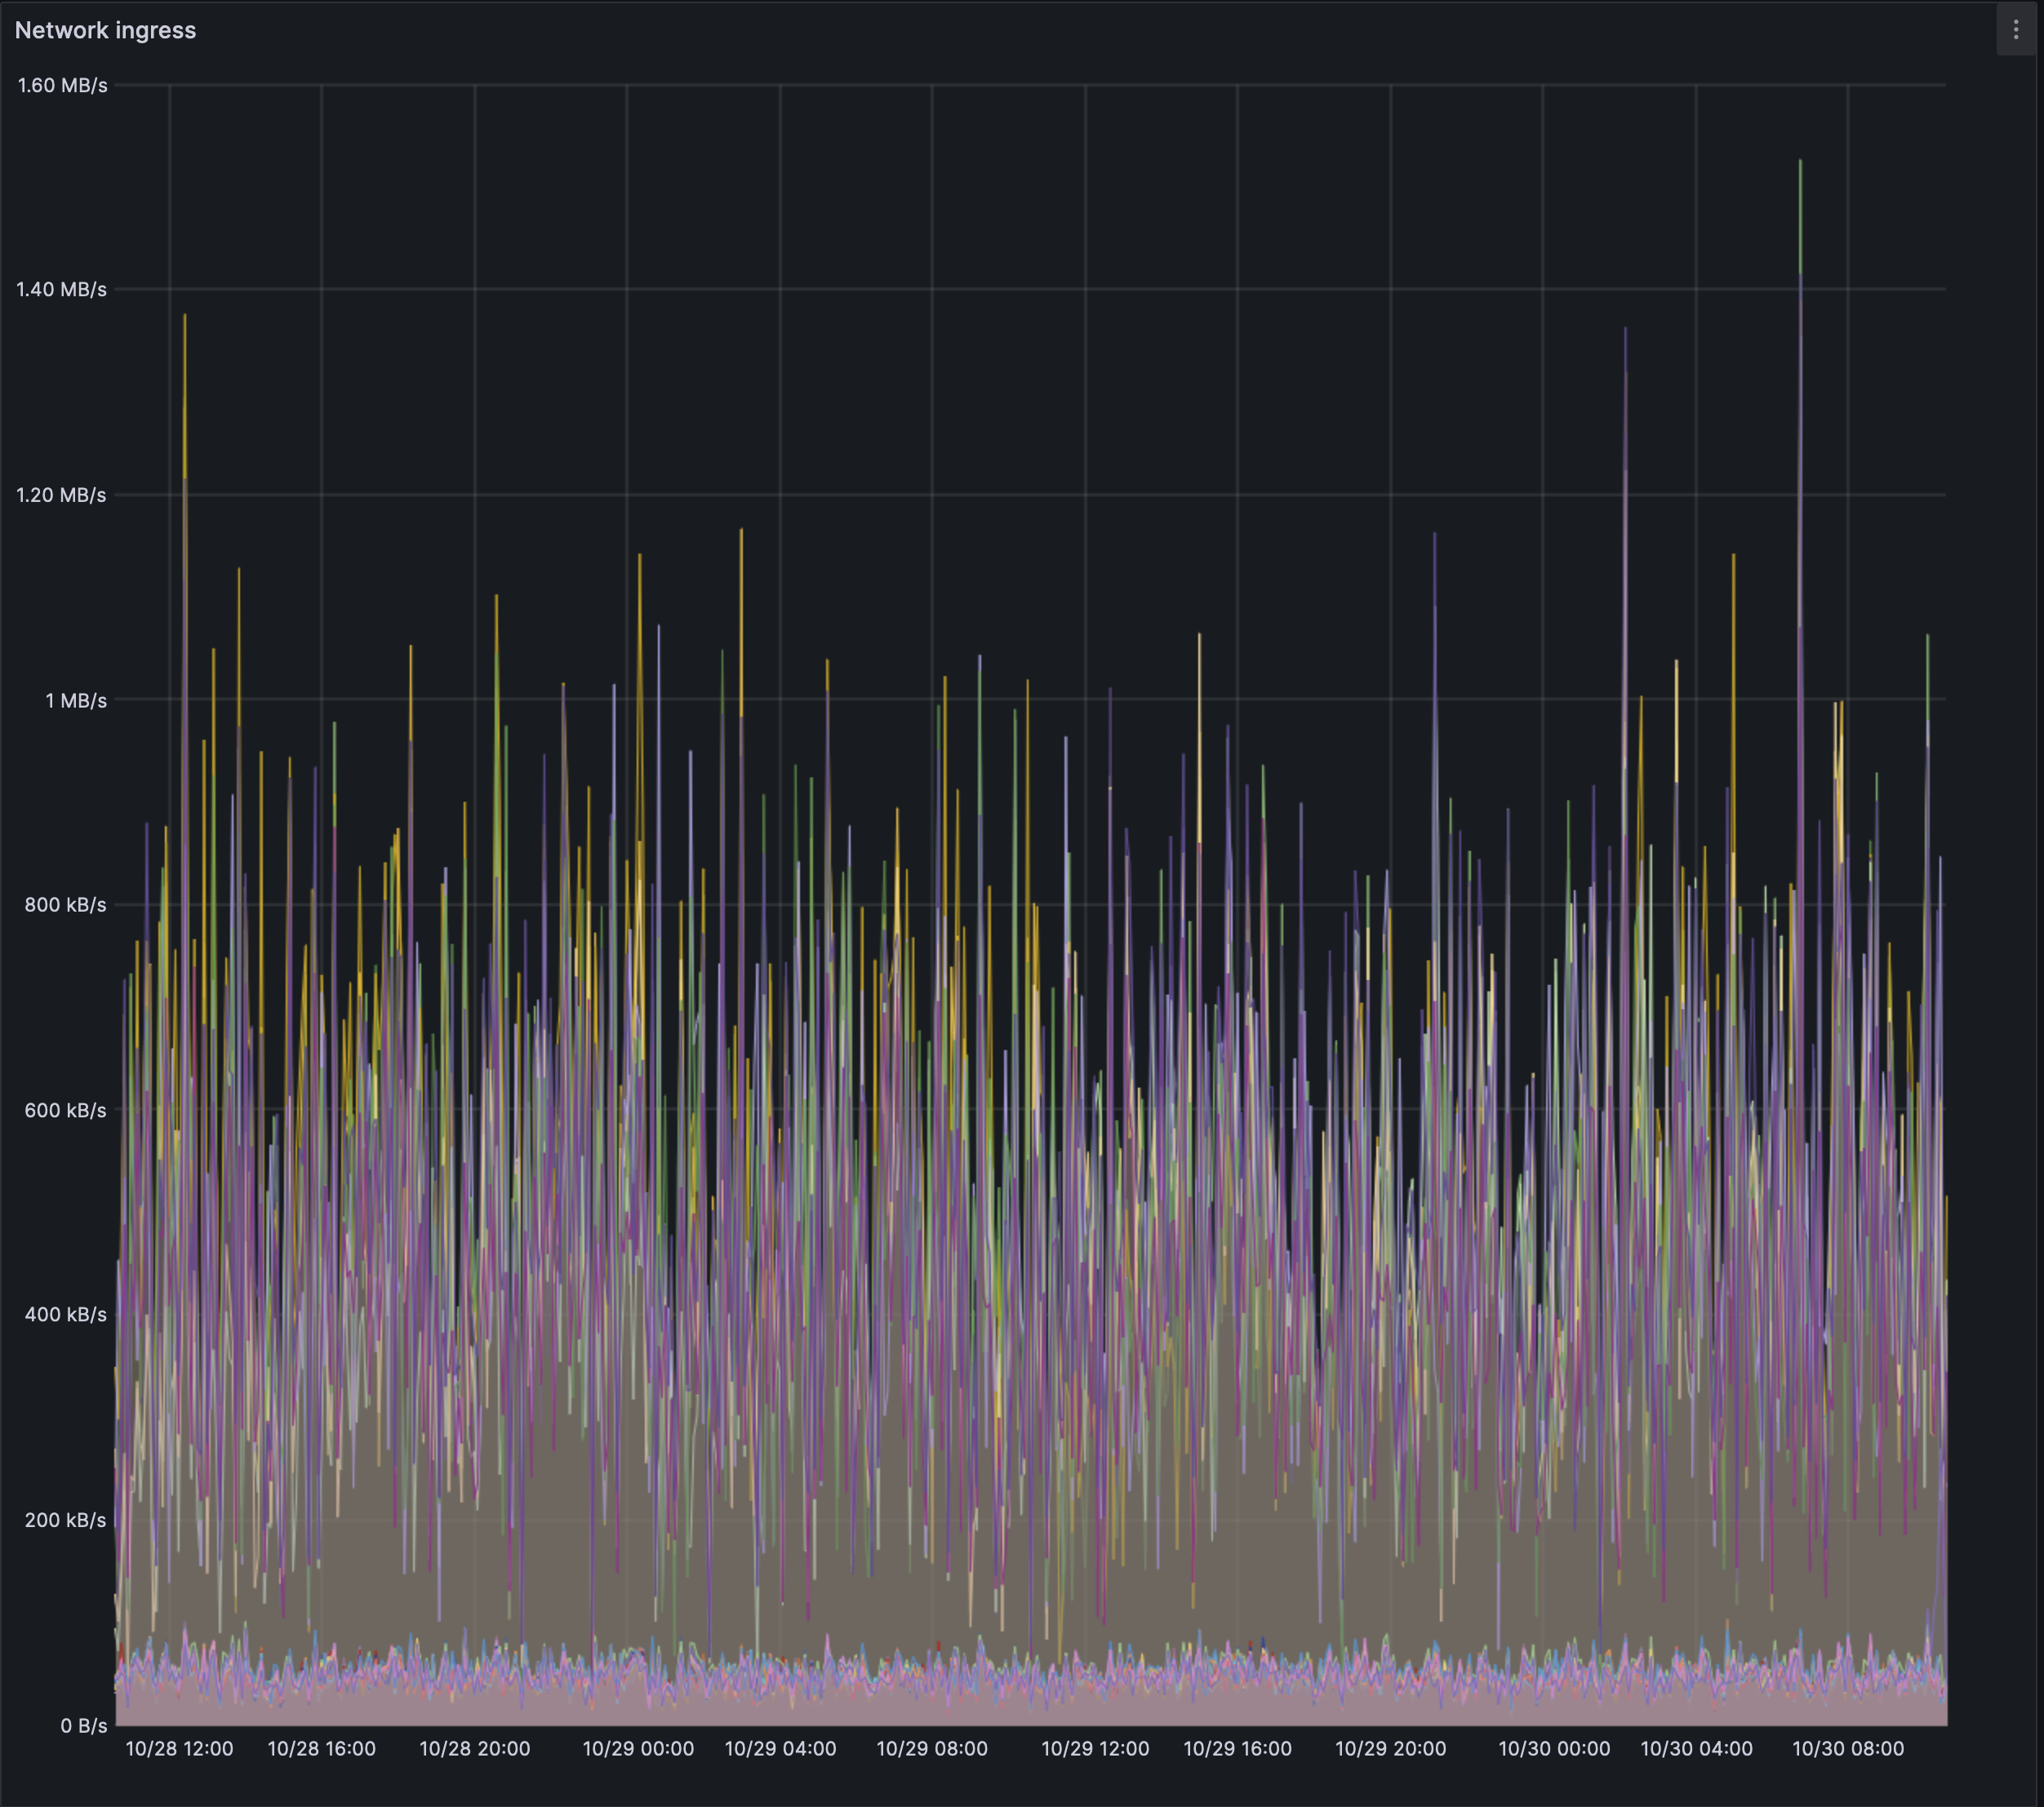
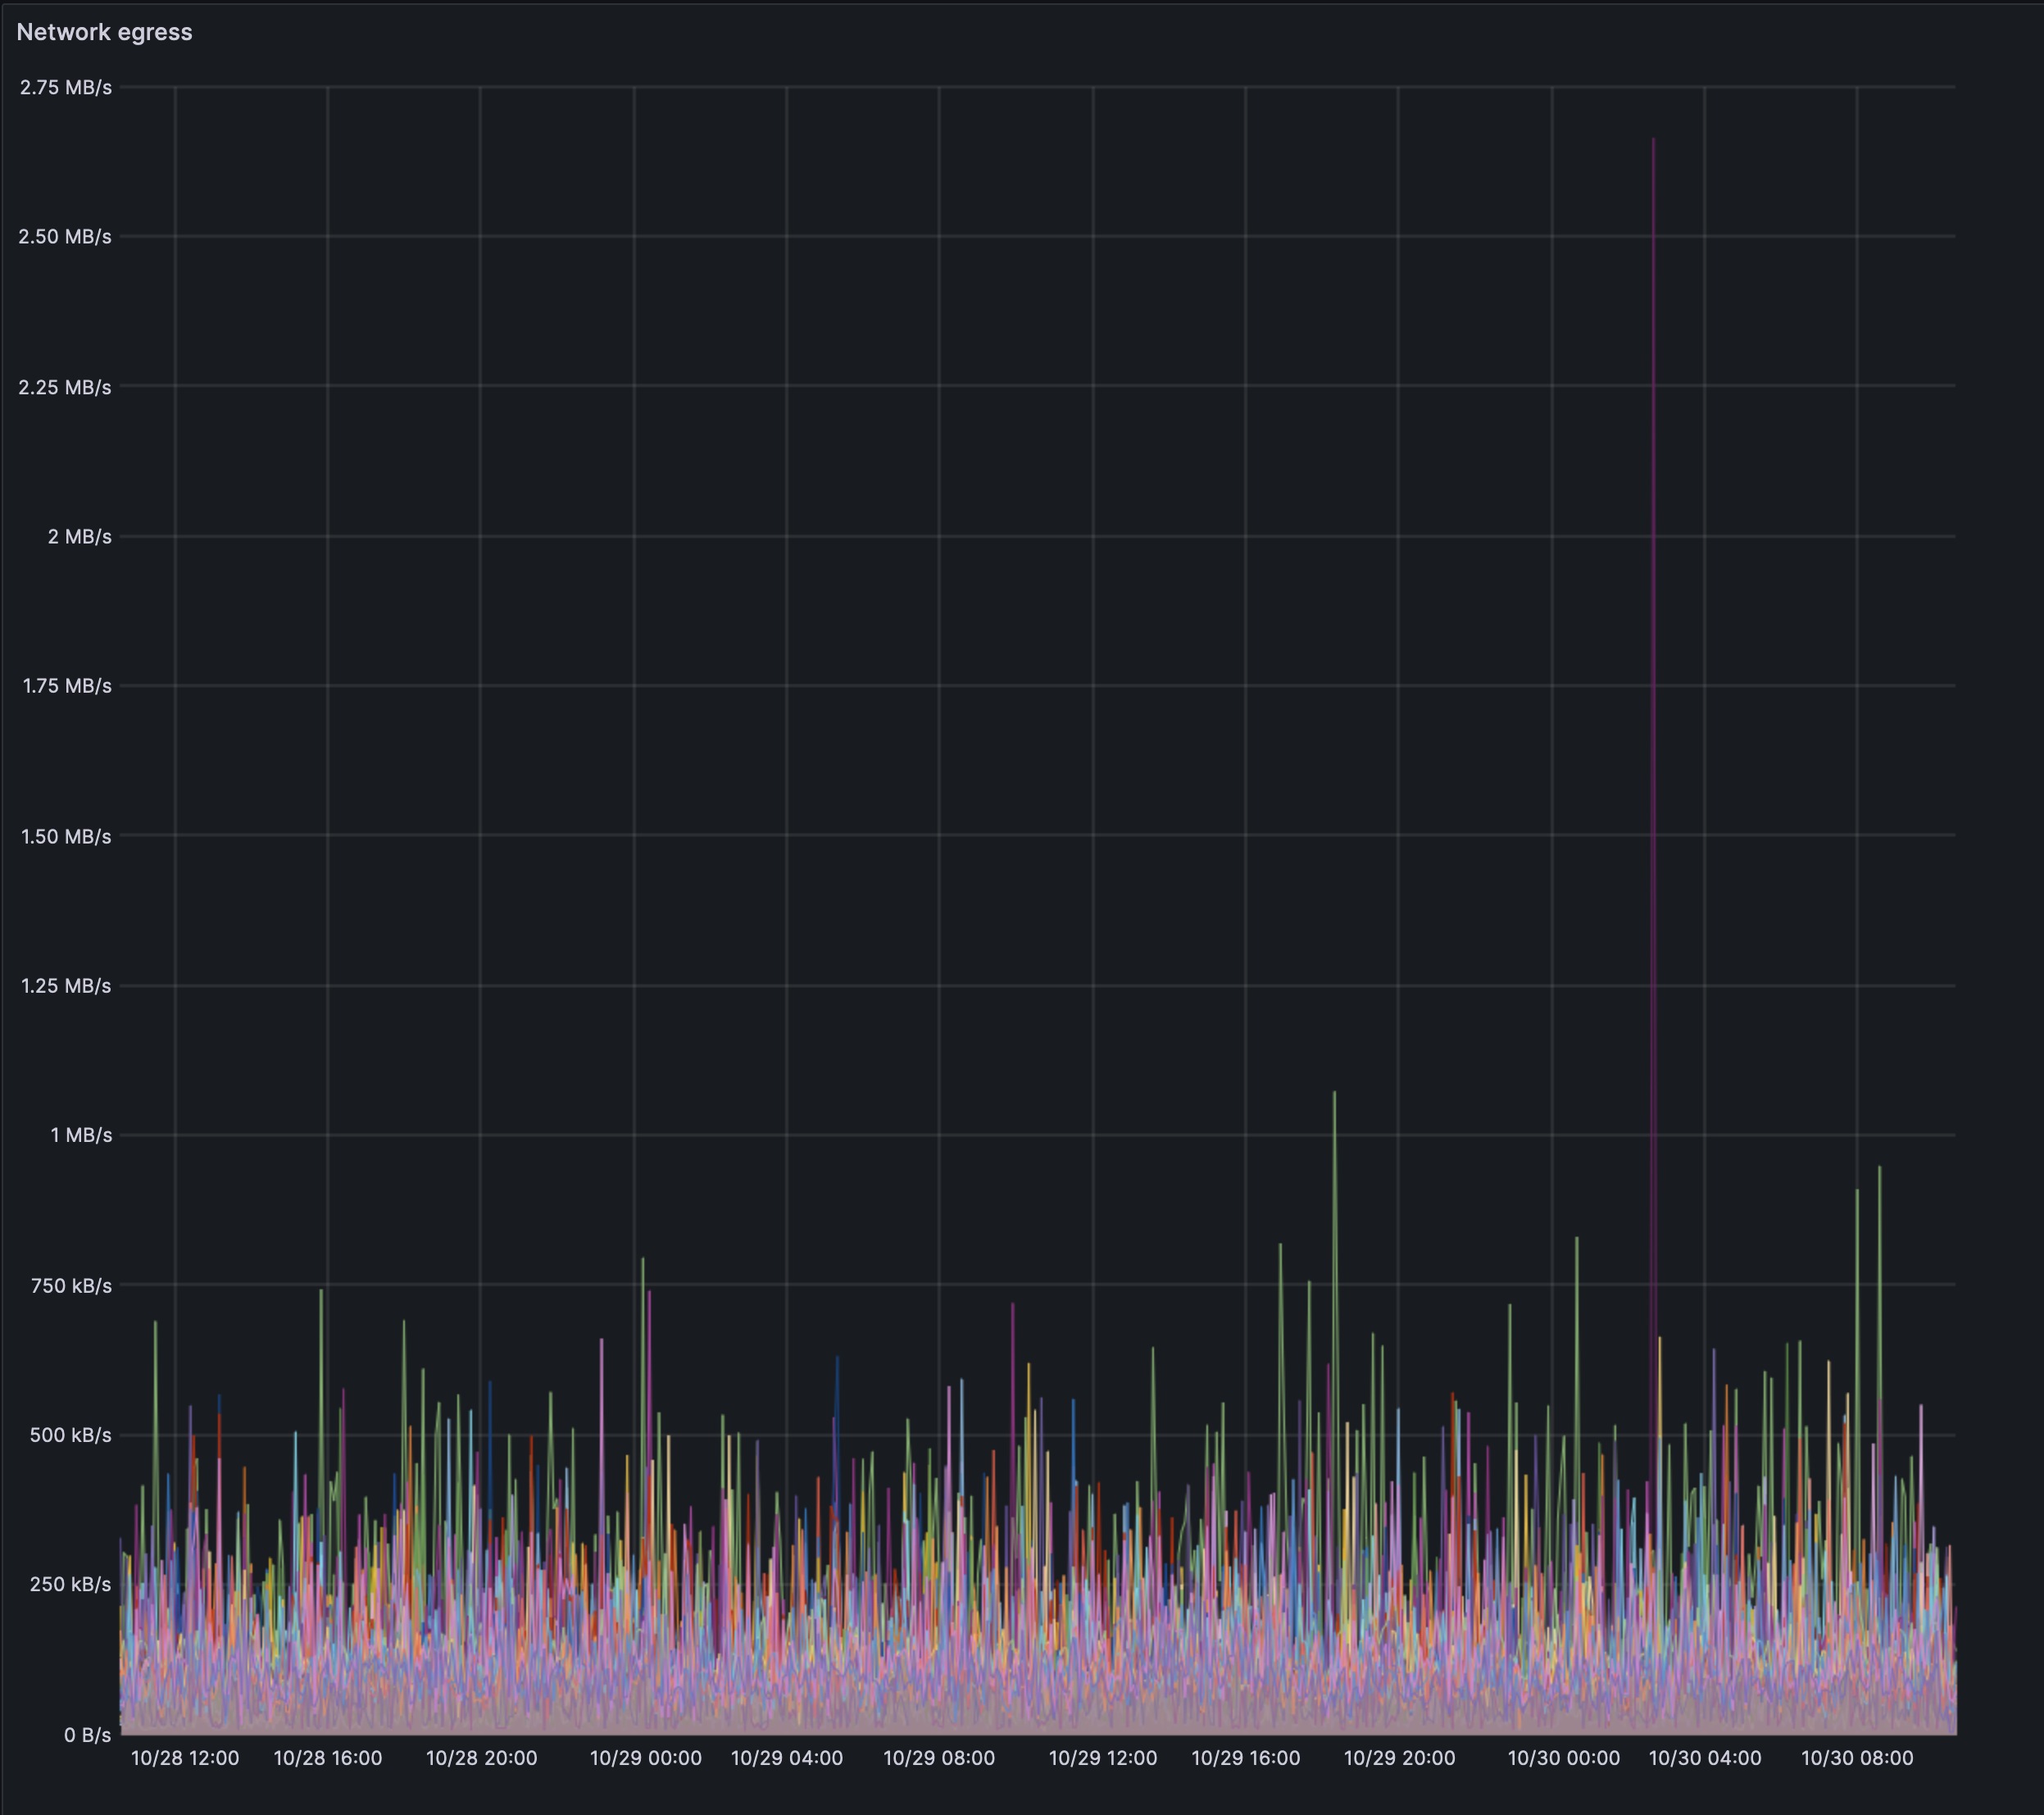
The Erigon nodes seem to have consistently higher ingress and egress metrics compared to the Geth nodes. But in general, we don't see any massive spikes and the network use seems stable across the span of ~2 days.
## Network health
Finality and participation rates are unchanged beyond margin of error.
The below data is for a timespan of 2 days, over the weekend of the 28th.
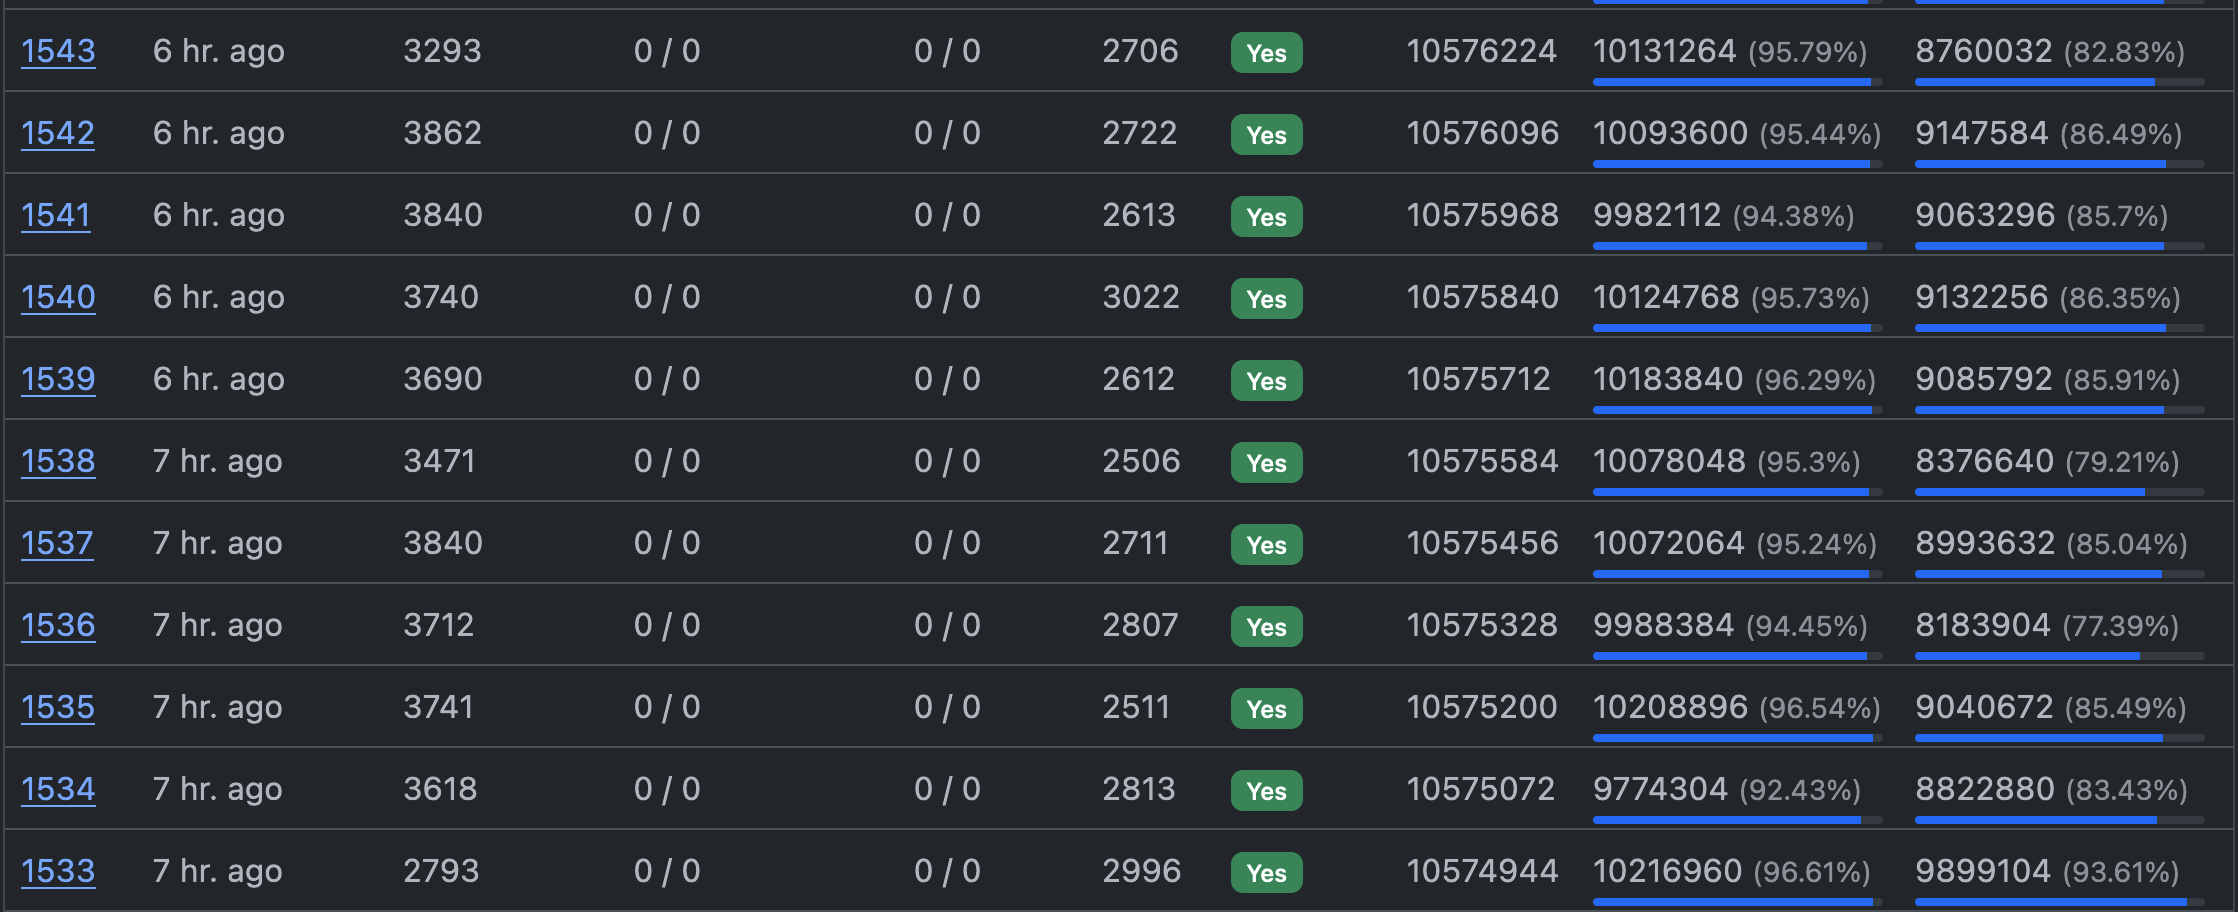
Re-orgs seem to indicate cause for concern.
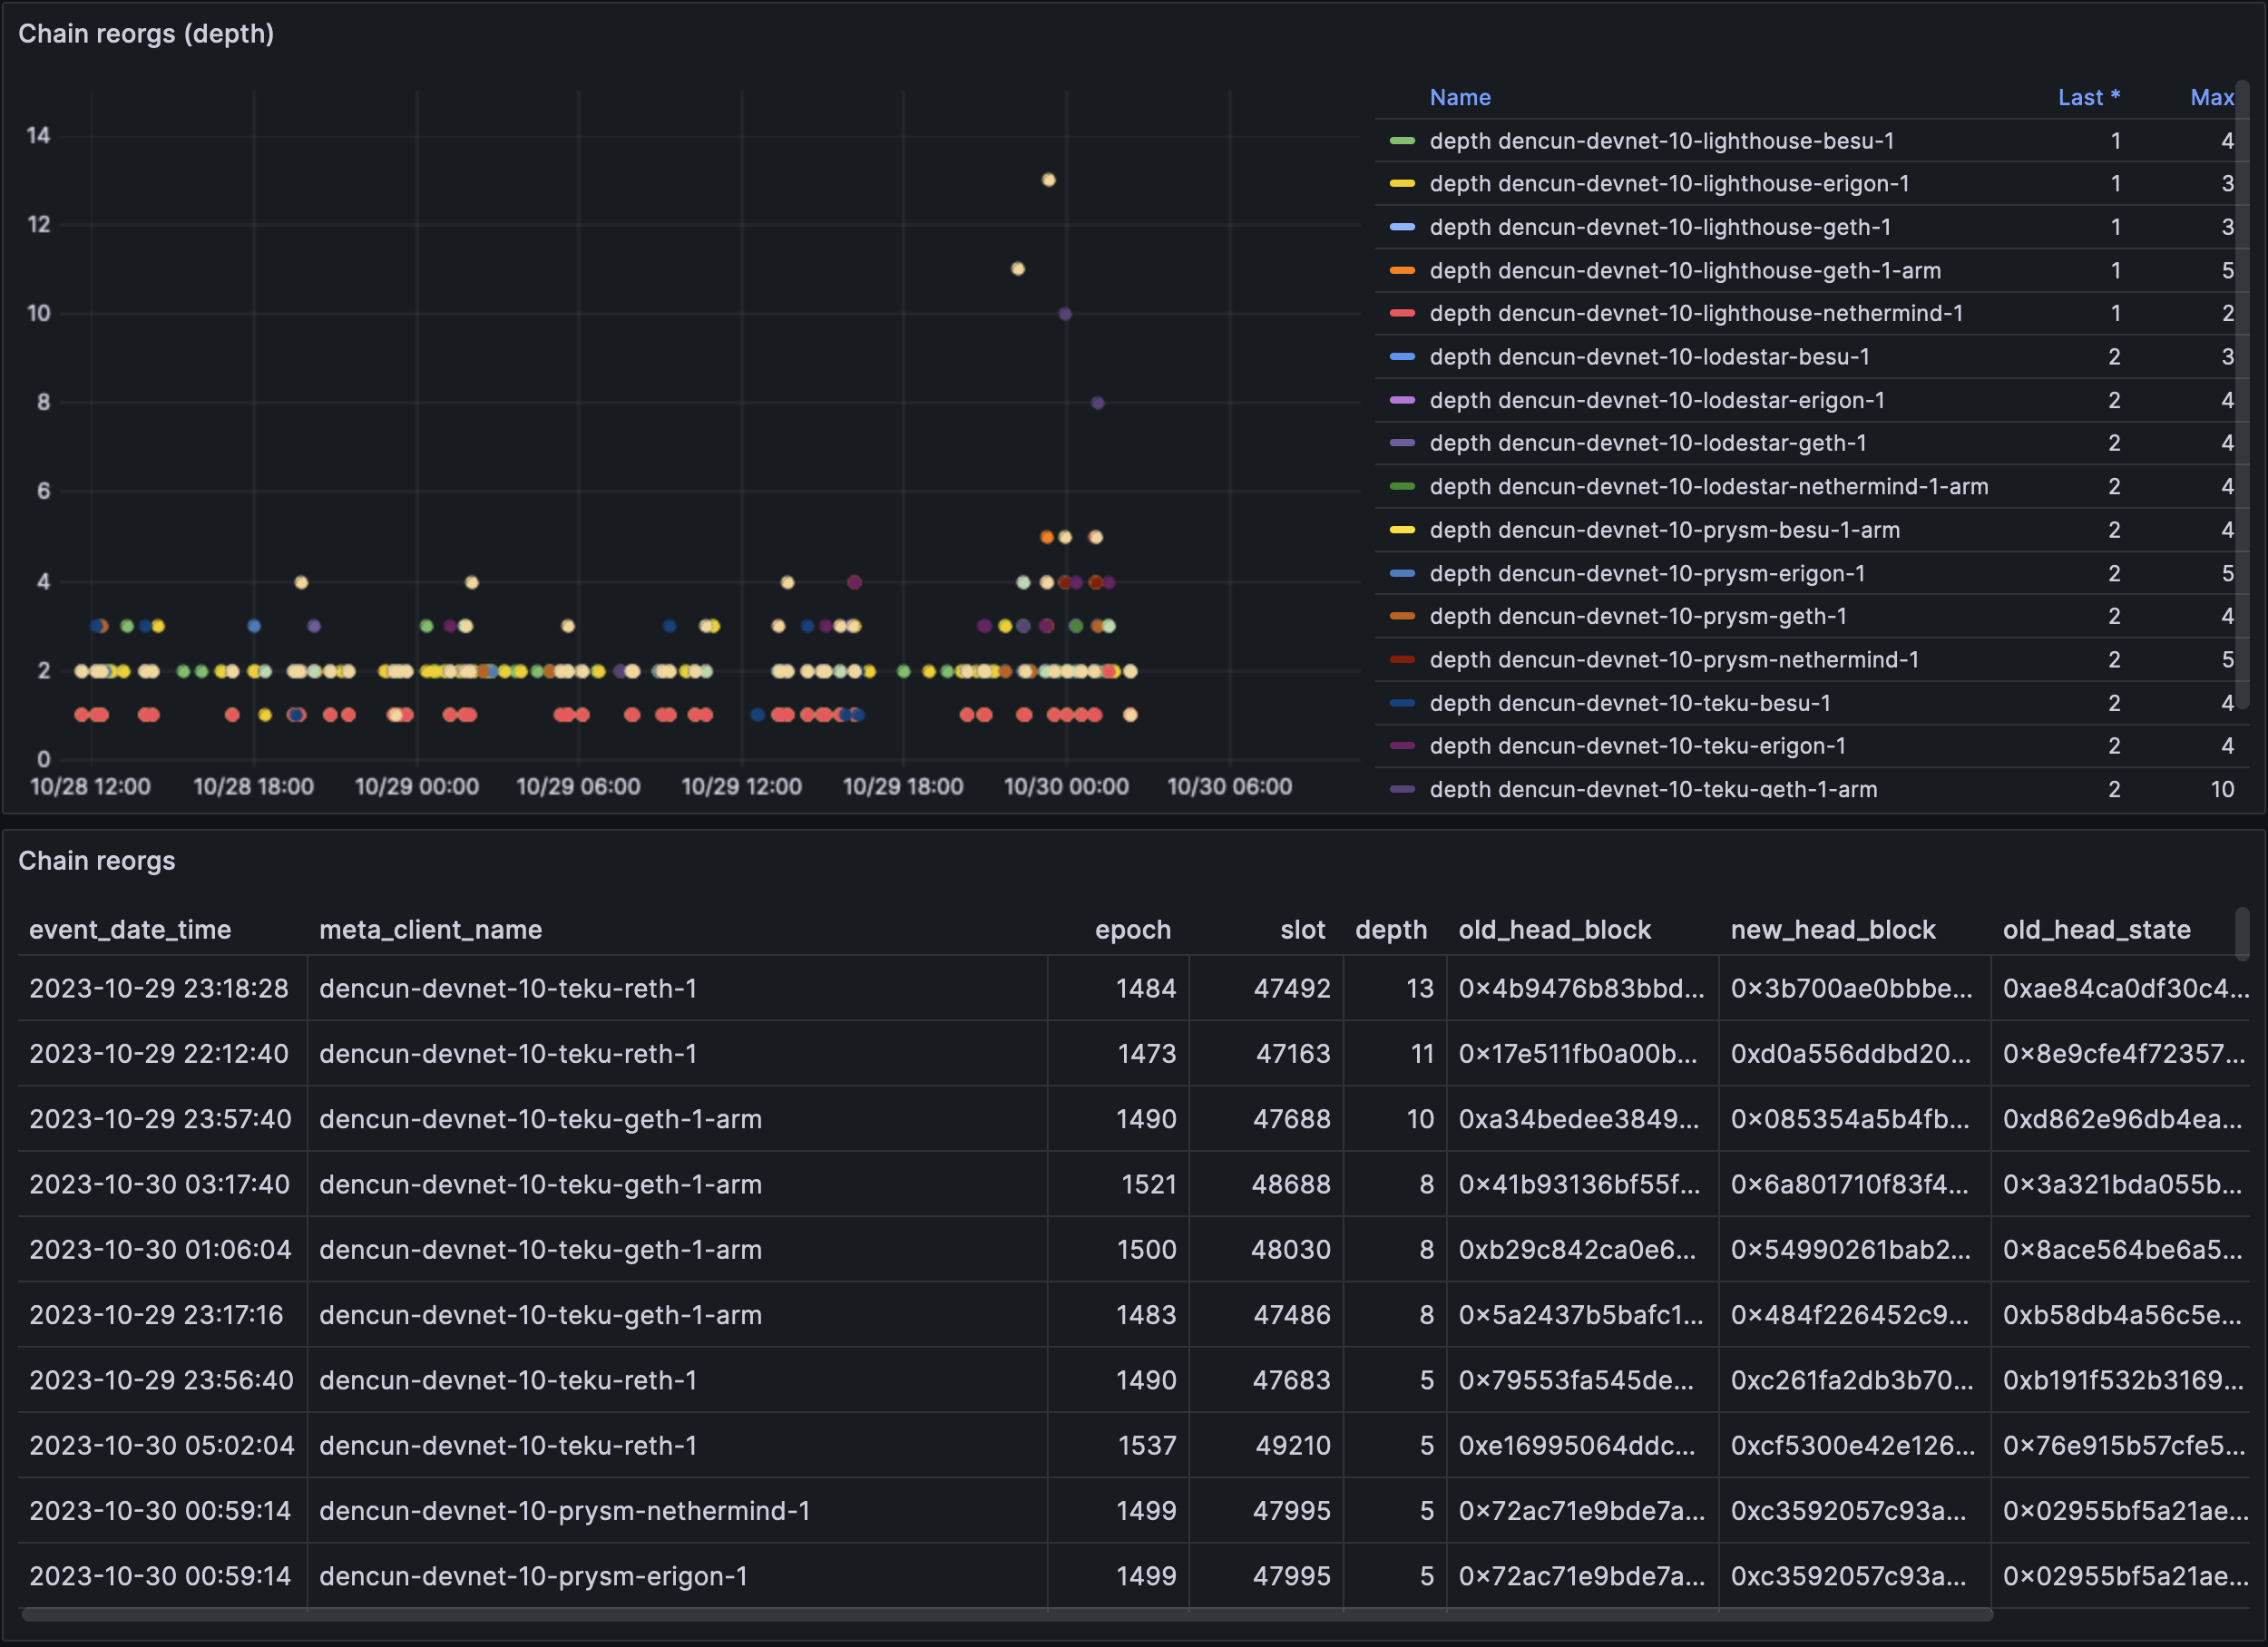
The re-org rate is quite high. Most seem to be of depth 2 and some are extremely deep. We're currently looking into this.
## Blob analysis
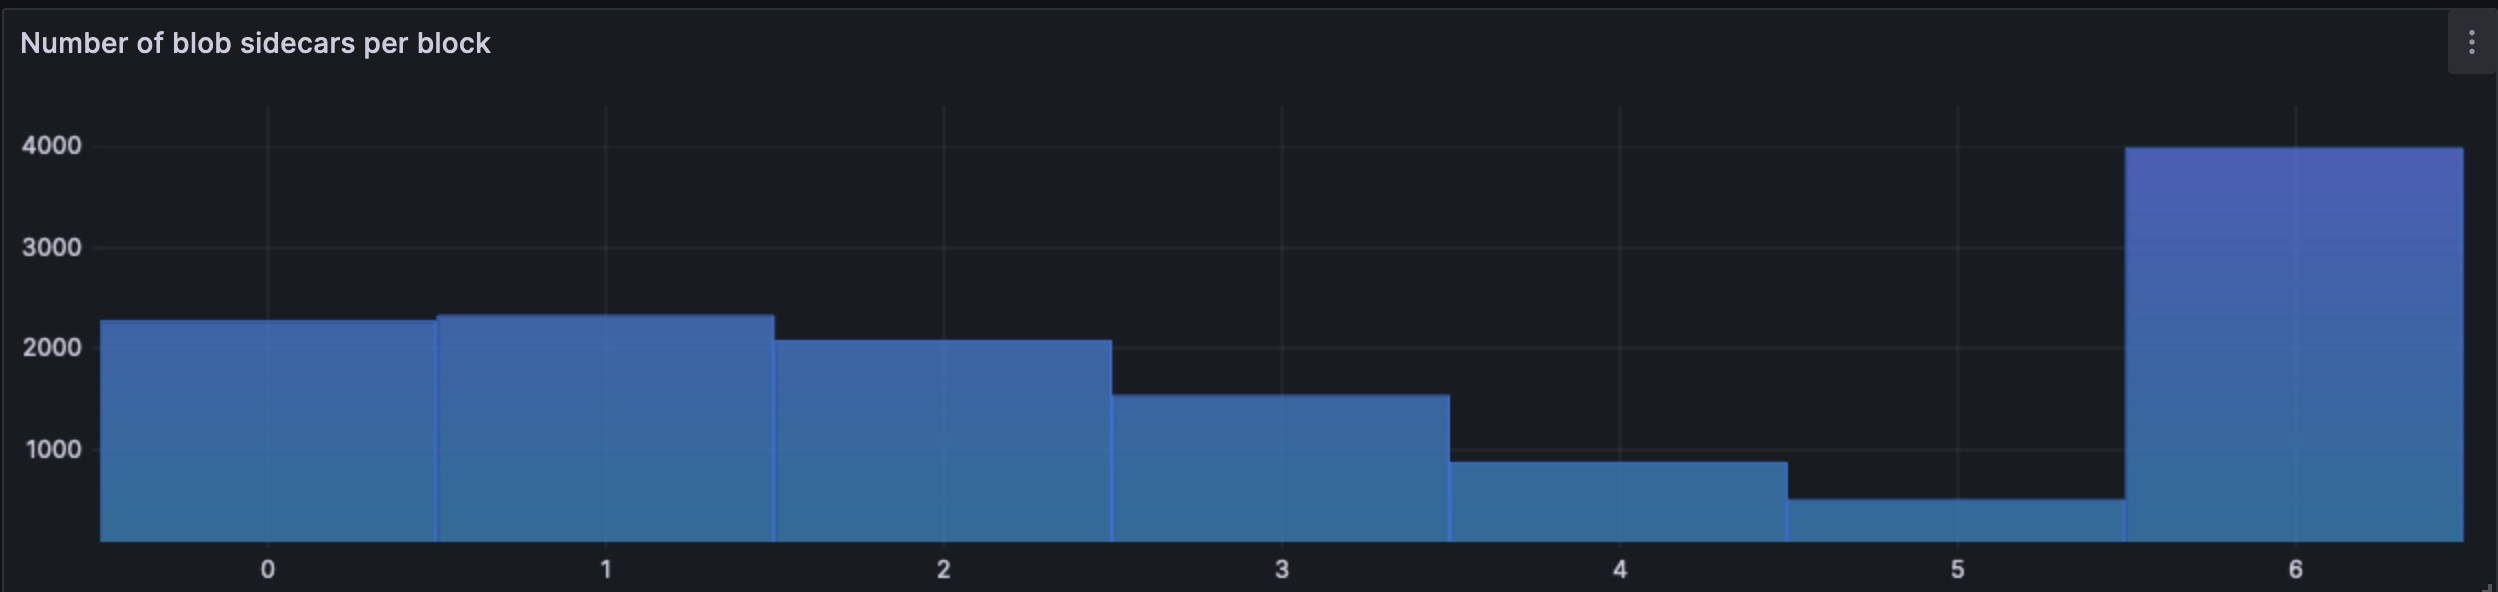
The graph describes the number of blobs per block over a span of ~2 days. i.e, most blocks included 6 blobs, indicating a stressed network scenario.
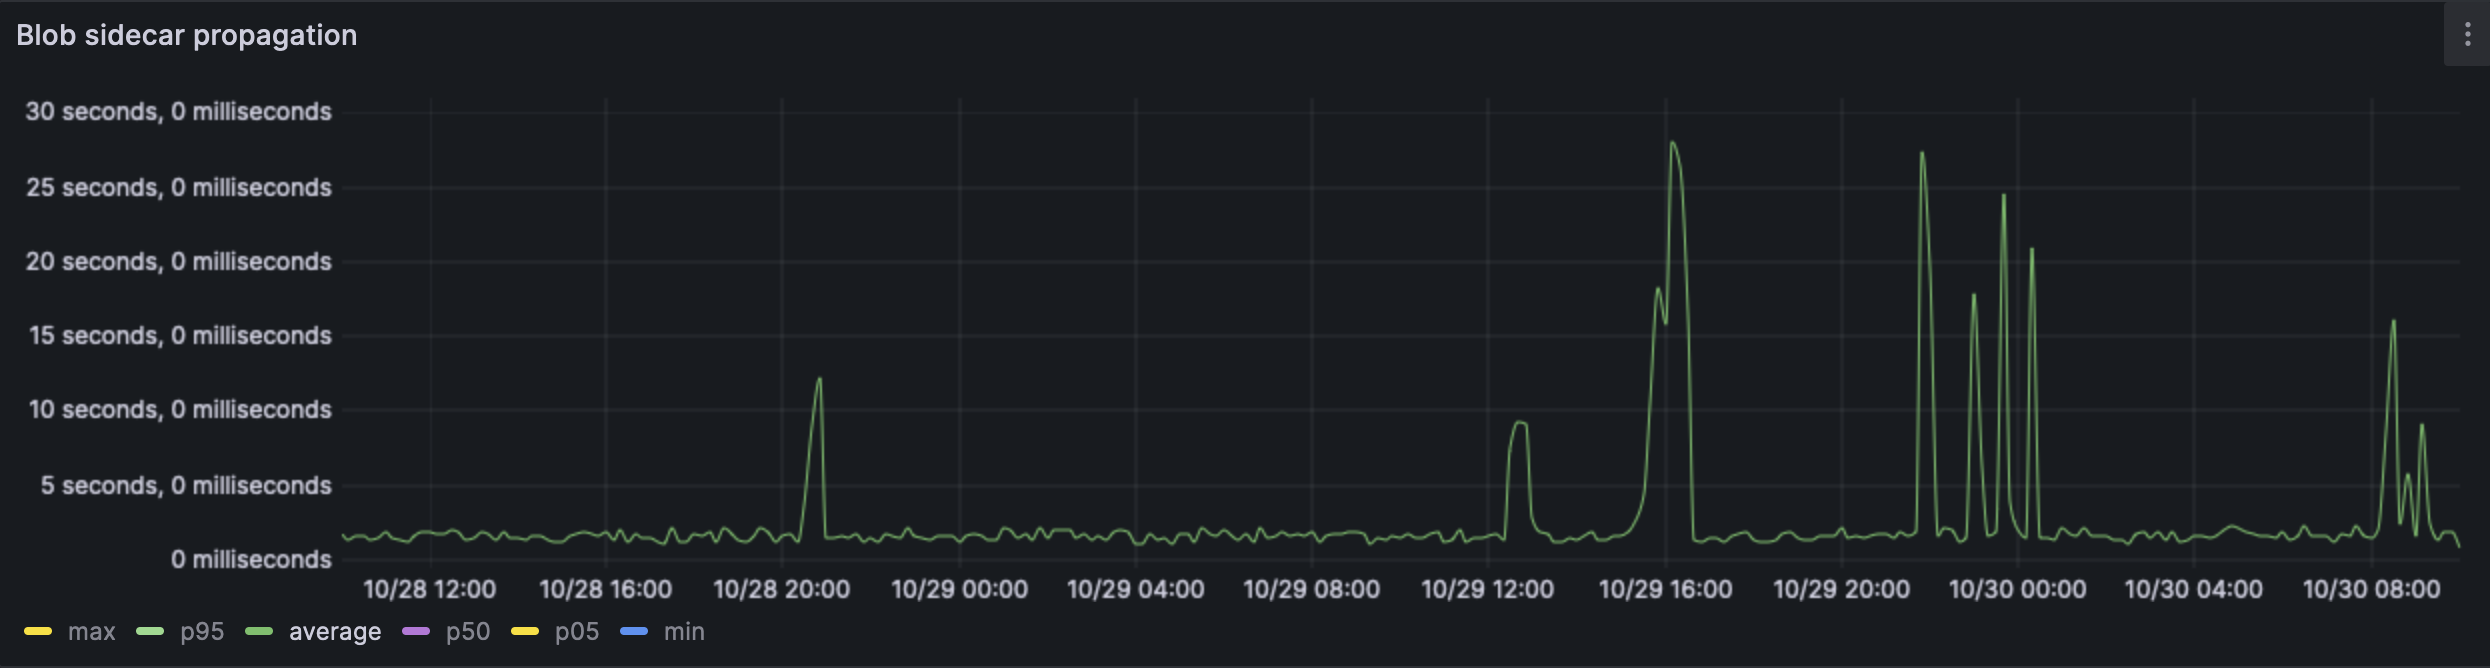
On average, the blobs have a ~1.3s propagation time. This is heavily influenced by our blobber adding an artifical delay of 2s for 10% of blobs. However, the spikes of 30s are not explained and we are looking for theories as to how.
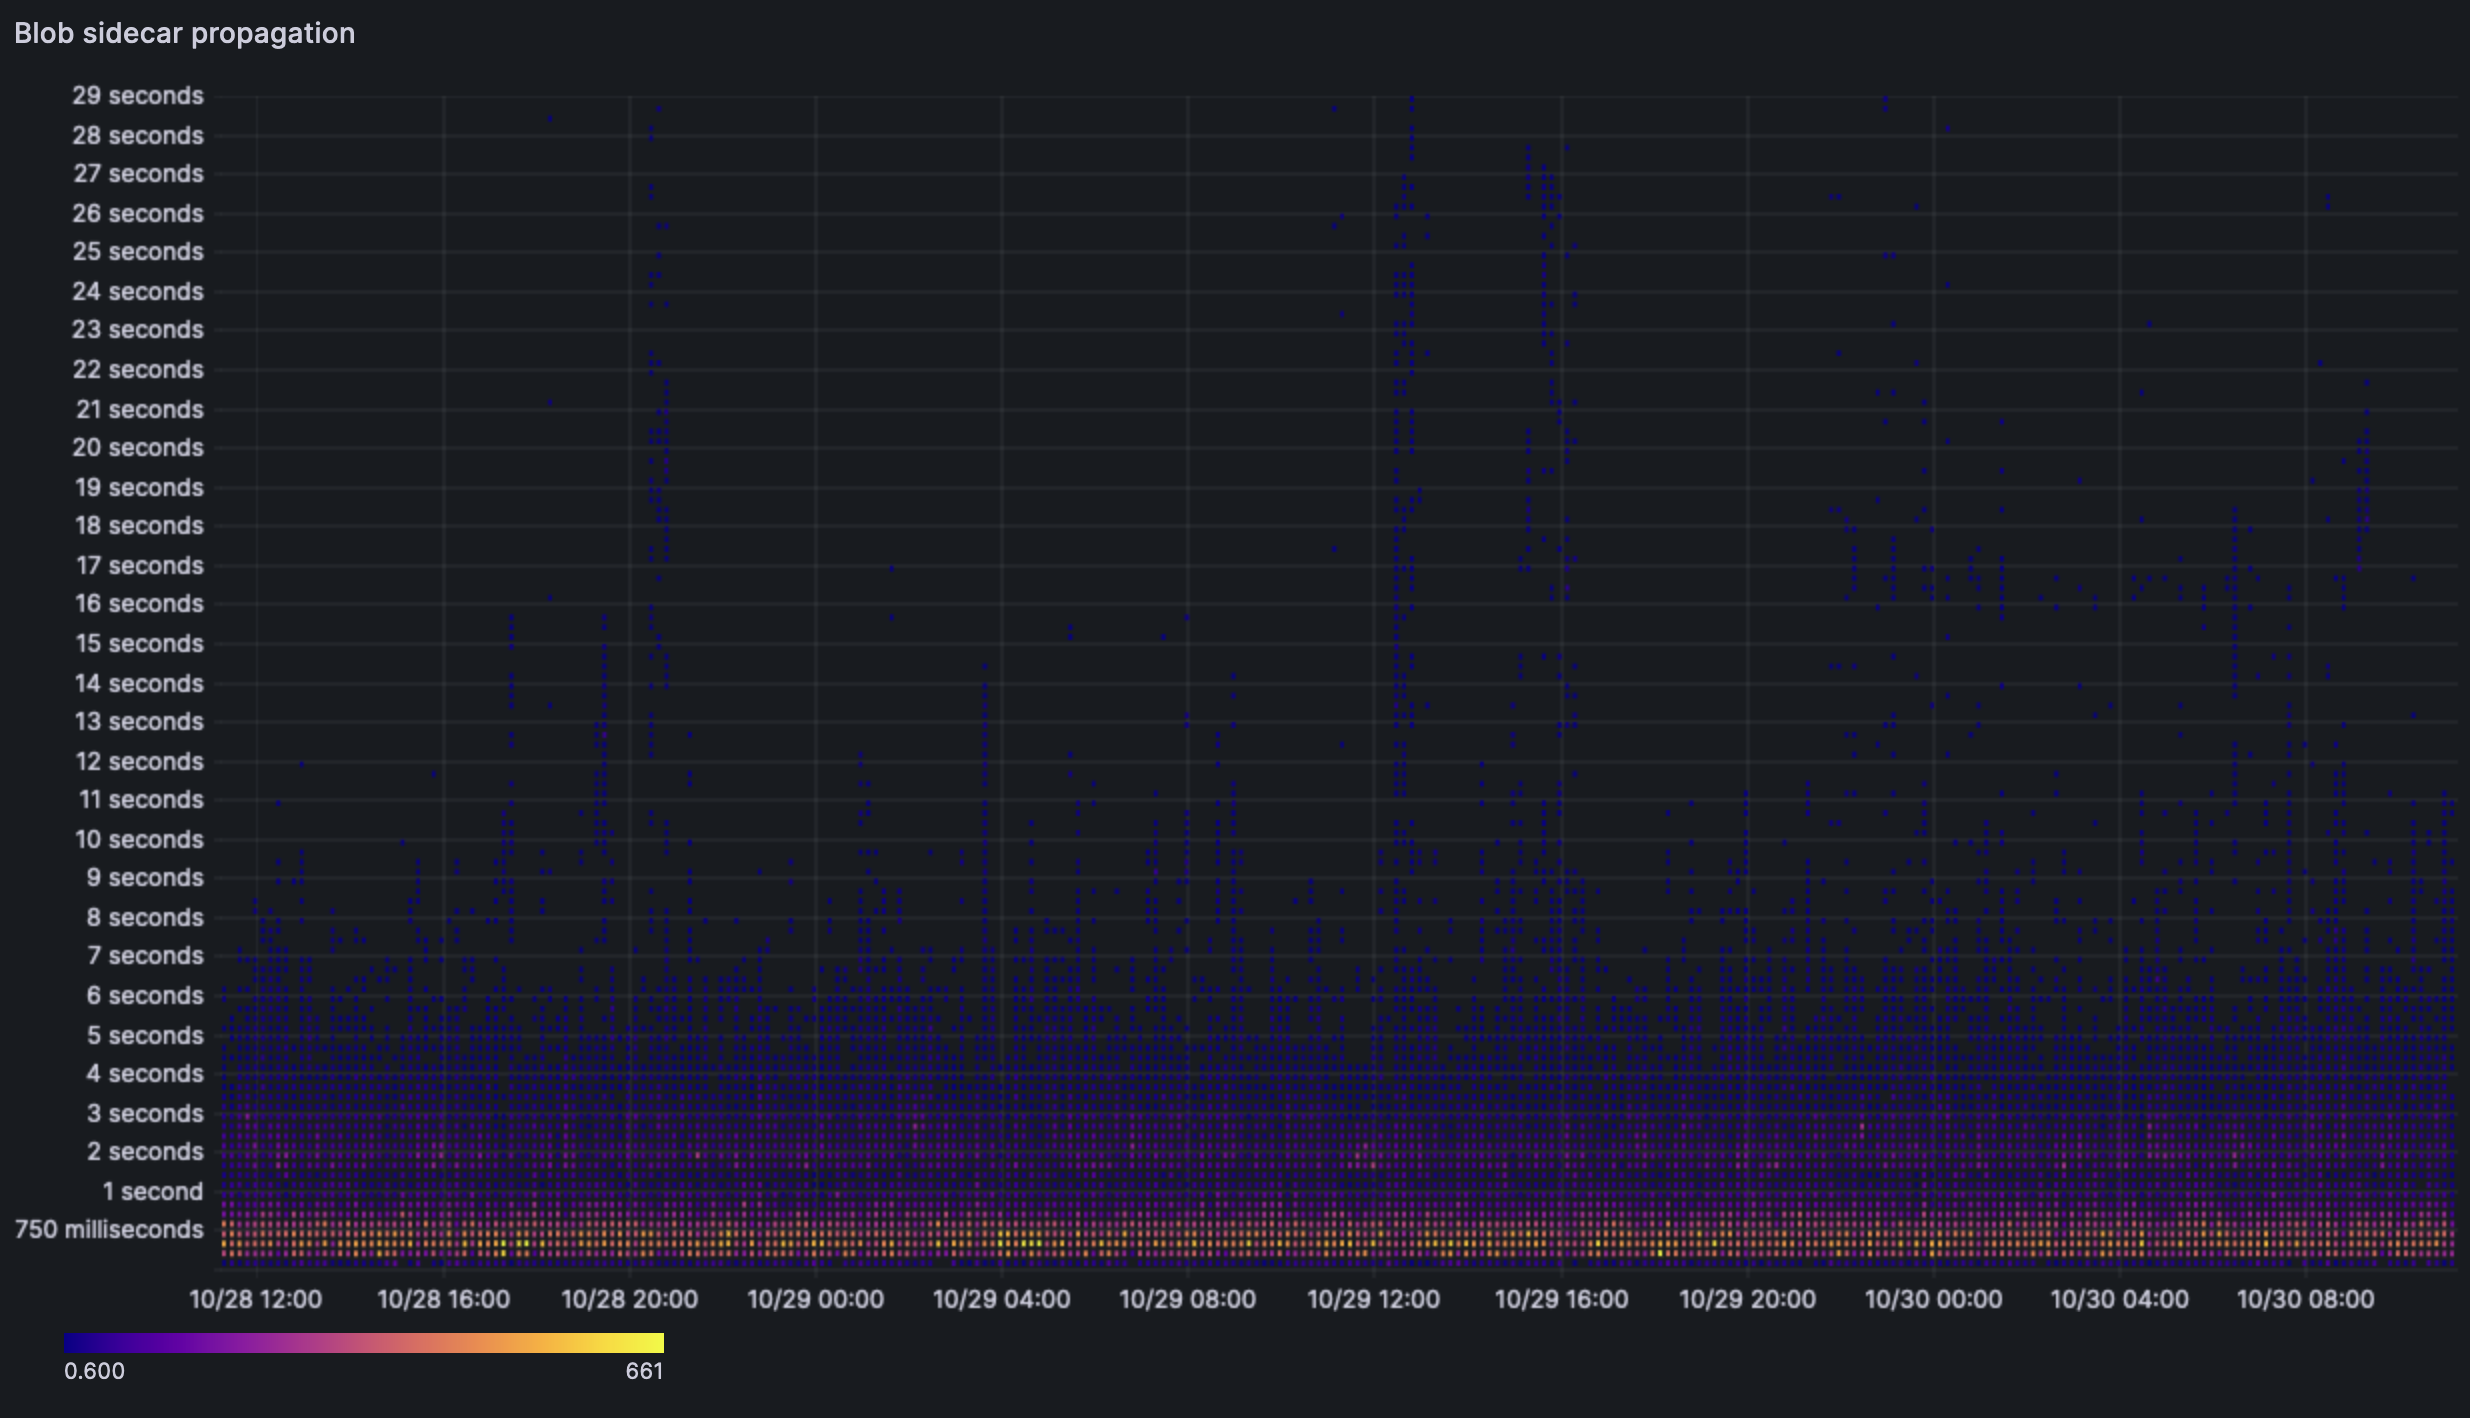
The heatmap indicates that most blobs are still arriving within the 1s mark. But the heatmap is definitely not as strong as earlier and one can see a second front forming on the ~2s mark.
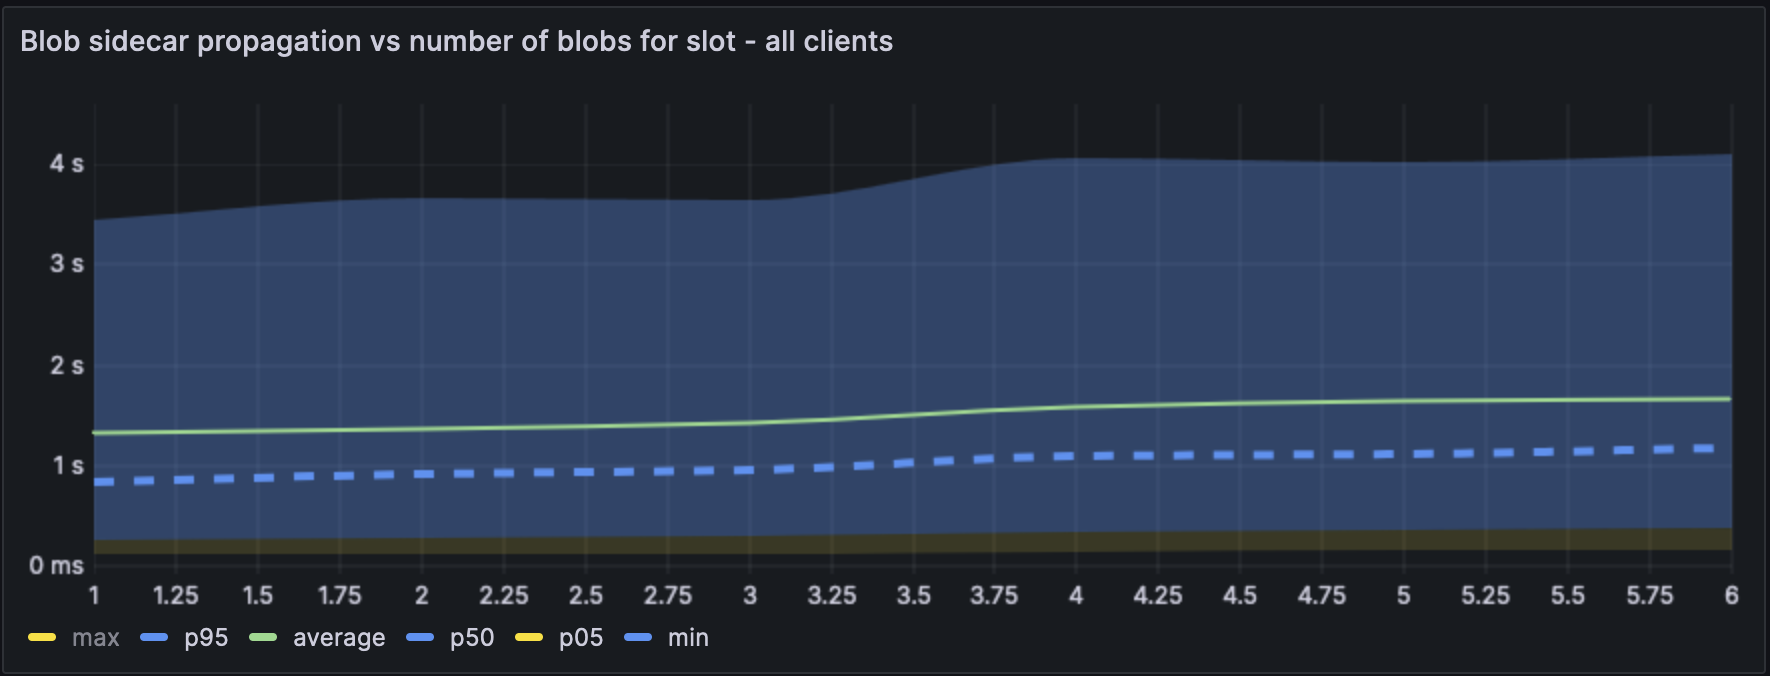
The blob propagation difference from 1 to 6 is a difference of 300ms, which is good news.
## Block/attestation analysis:
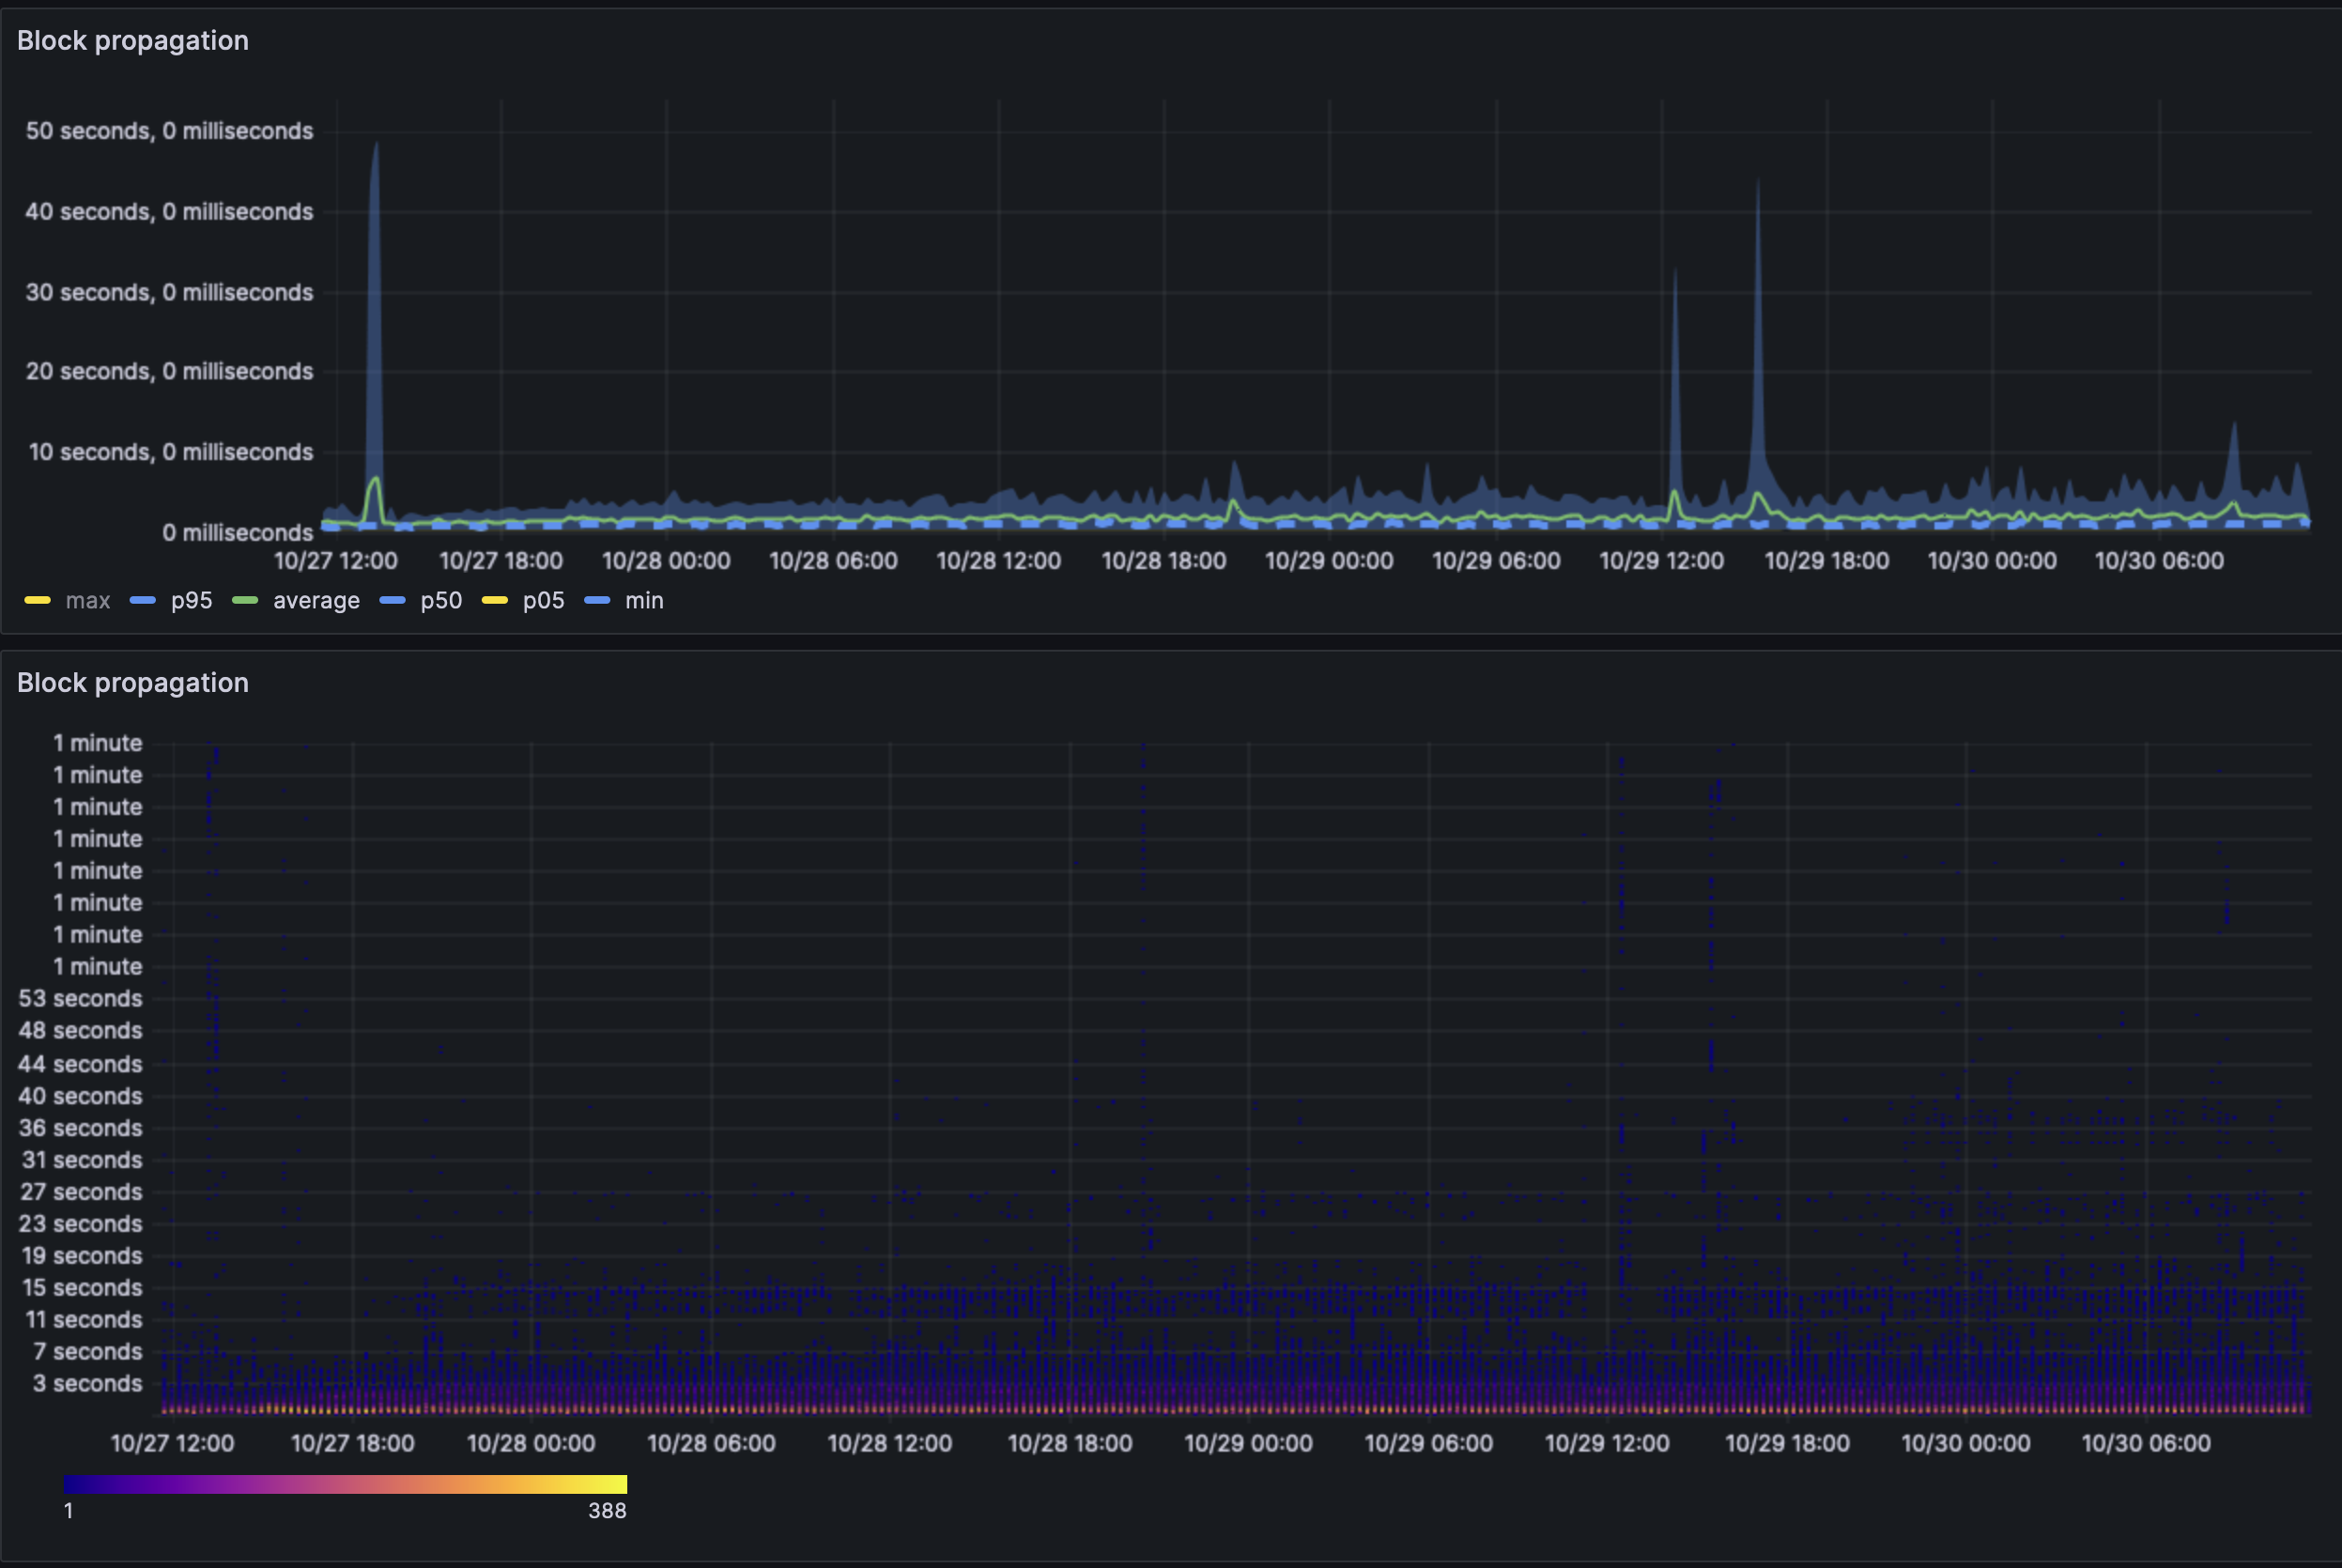
The average case block propagation time is ~1.5s with the p95 value at the ~4s mark.
Compared to the stress test scenario, we see an increase in ~2s delay. i.e, the blobber adding a latency of 2s indeed led to a increase in block propagation time.
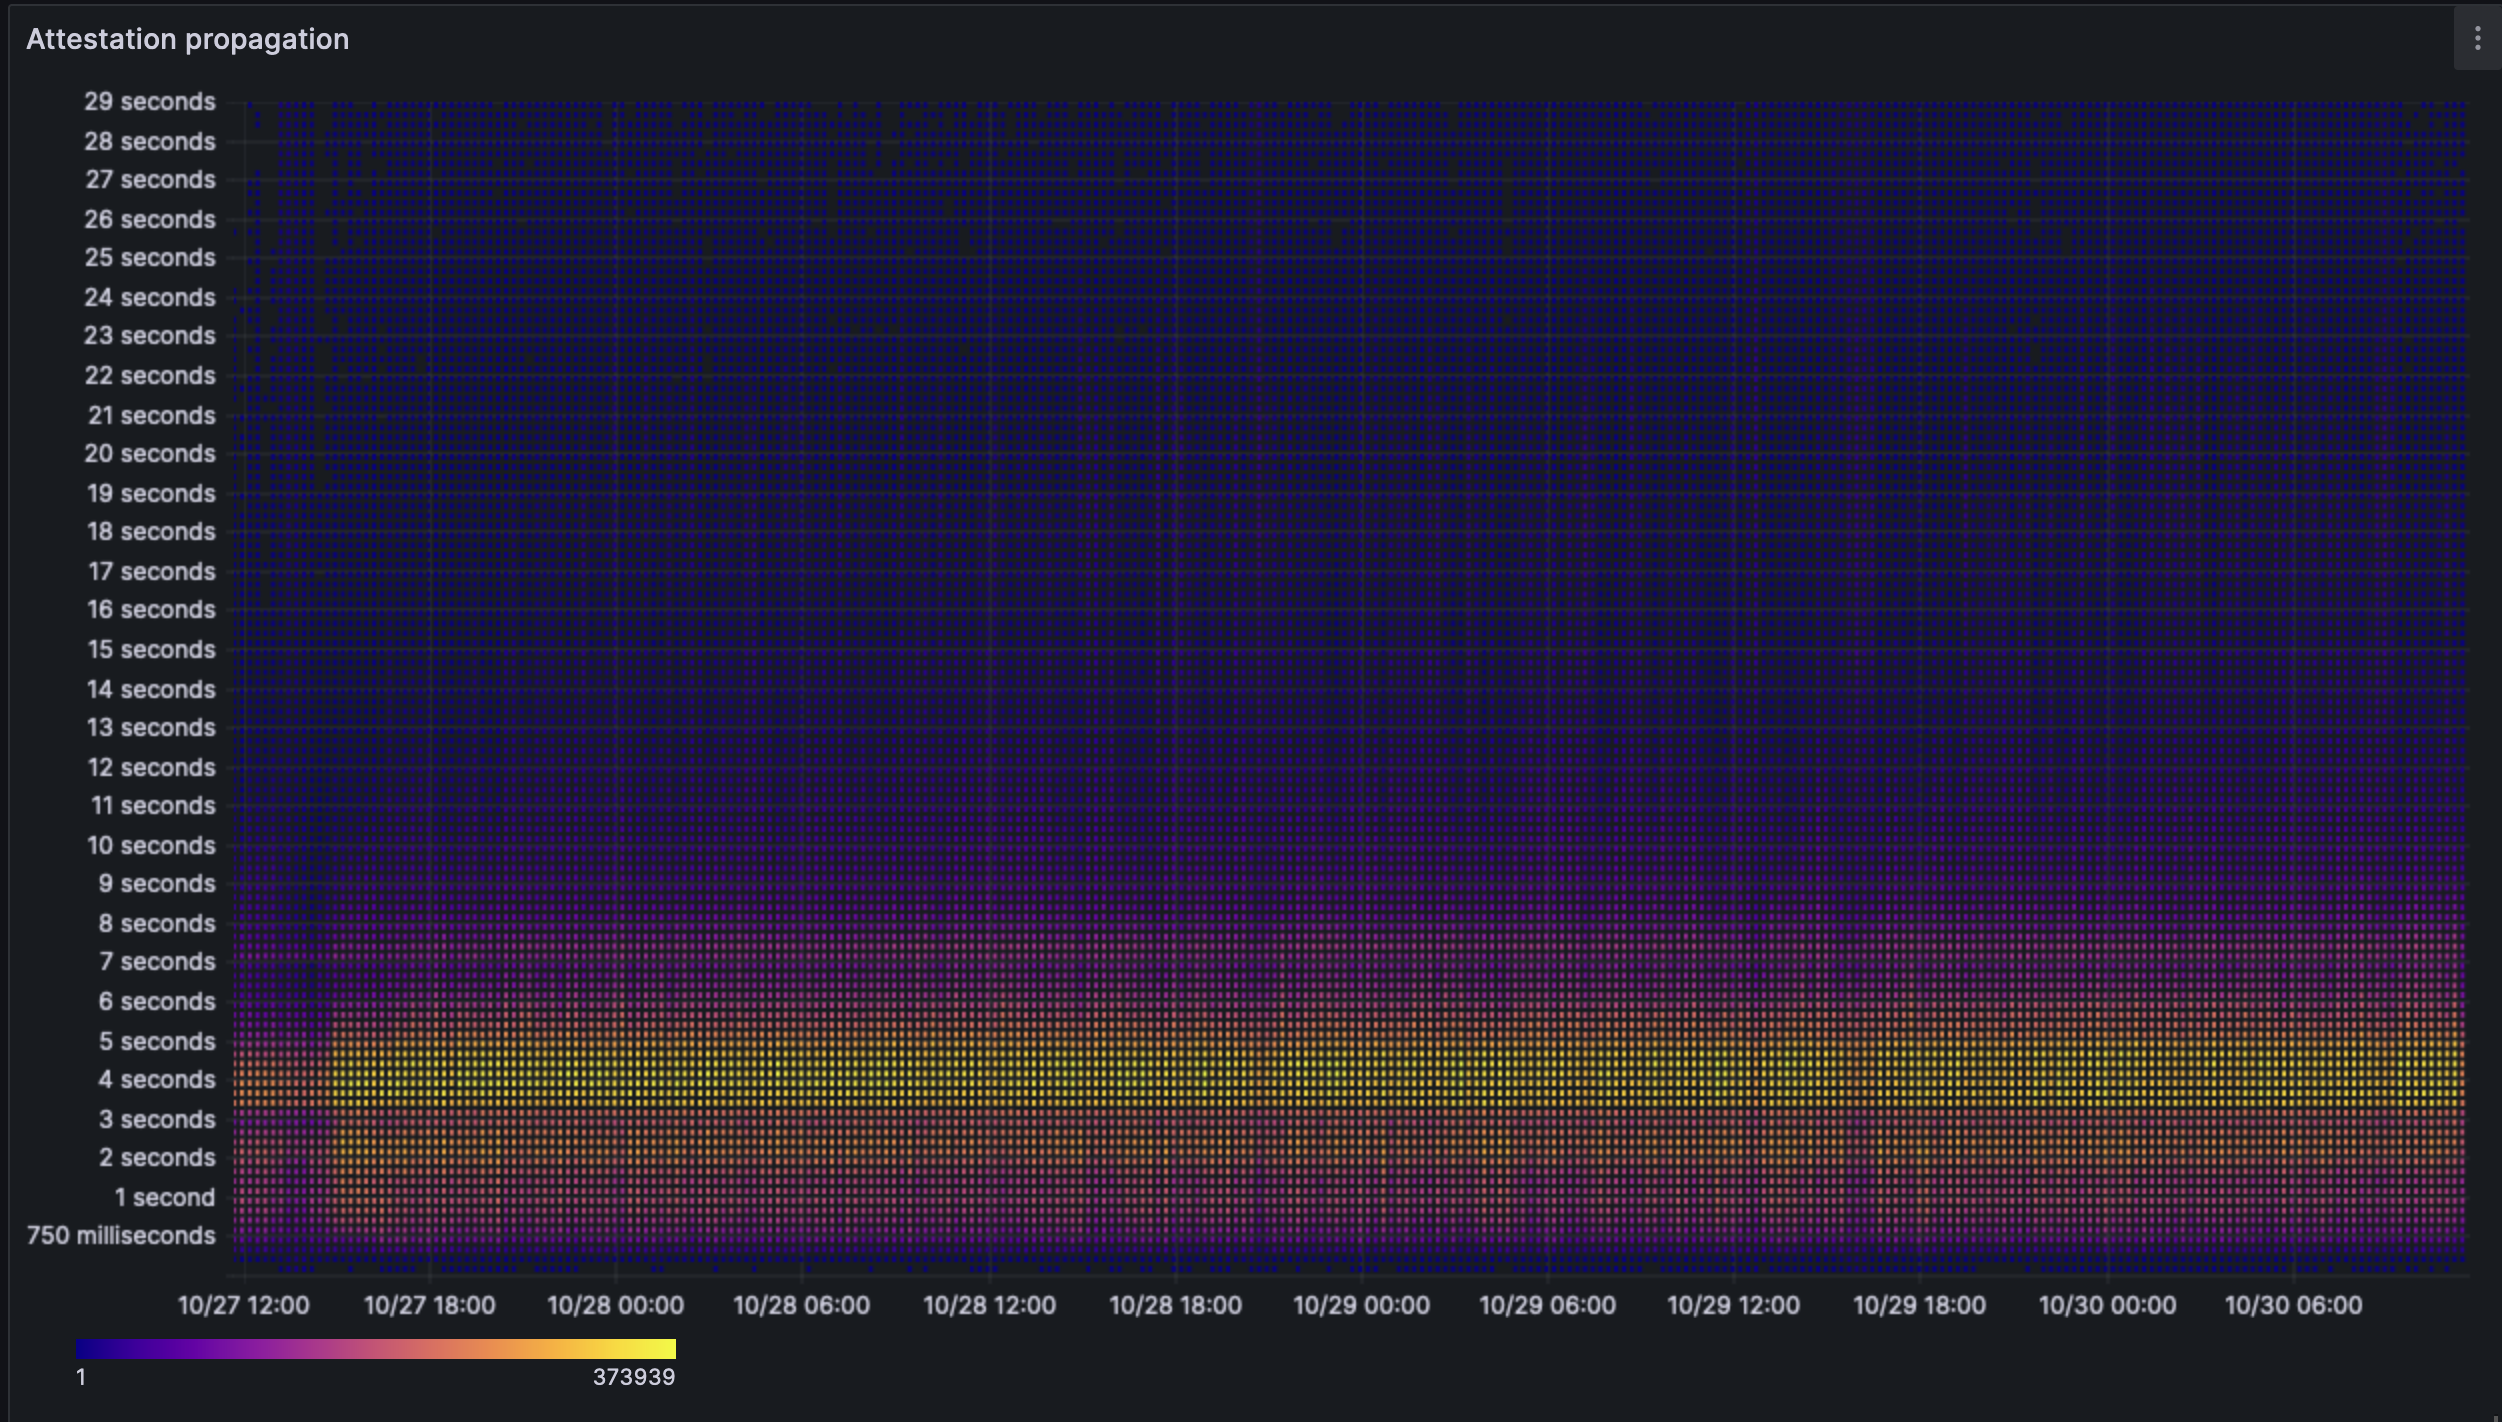
Attestation propagation over the spam of ~3 days. The initial bump is due to the starting of the blobber with the latency action. Since then, one can see the latency increase in attestation increased by a proportional number.
The Head Vote rate seems to drop for an unexplained reason in certain epochs even when the Target Vote stays high.
```
graffiti | block_count | with_blobs | blob_rate
-----------------------+-------------+------------+-----------
nimbus/reth | 24 | 23 | 0.96
prysm/reth | 109 | 101 | 0.93
lighthouse/reth | 102 | 94 | 0.92
lodestar/geth | 2589 | 2356 | 0.91
lighthouse/nethermind | 3214 | 2901 | 0.90
teku/reth | 41 | 37 | 0.90
nimbus/besu | 1274 | 1151 | 0.90
prysm/geth | 2840 | 2538 | 0.89
nimbus/geth | 2971 | 2656 | 0.89
teku/nethermind | 3245 | 2892 | 0.89
teku/geth | 3320 | 2965 | 0.89
lighthouse/besu | 1258 | 1124 | 0.89
lighthouse/geth | 3233 | 2875 | 0.89
nimbus/nethermind | 3213 | 2856 | 0.89
prysm/besu | 1276 | 1140 | 0.89
lodestar/besu | 1222 | 1078 | 0.88
prysm/nethermind | 3255 | 2844 | 0.87
teku/besu | 1024 | 884 | 0.86
lodestar/ethereumjs | 40 | 34 | 0.85
lodestar/reth | 10 | 8 | 0.80
lodestar/nethermind | 13 | 10 | 0.77
lodestar/erigon | 1085 | 824 | 0.76
lighthouse/erigon | 1357 | 818 | 0.60
prysm/erigon | 1282 | 517 | 0.40
teku/erigon | 1345 | 441 | 0.33
nimbus/erigon | 1273 | 381 | 0.30
nimbus/ethereumjs | 6 | 1 | 0.17
lighthouse/ethereumjs | 6 | 0 | 0.00
```
No major change in stats.
## MEV analysis
```
graffiti | block_count | with_blobs | blob_rate
-----------------------+-------------+------------+-----------
teku/nethermind | 2 | 2 | 1.00
prysm/nethermind | 1 | 1 | 1.00
teku/besu | 2 | 2 | 1.00
teku/geth | 26 | 26 | 1.00
lighthouse/besu | 1 | 1 | 1.00
lighthouse/geth | 3 | 3 | 1.00
lighthouse/nethermind | 13 | 13 | 1.00
lodestar/nethermind | 1 | 1 | 1.00
nimbus/besu | 2 | 2 | 1.00
nimbus/geth | 6 | 6 | 1.00
nimbus/nethermind | 2 | 2 | 1.00
prysm/besu | 12 | 12 | 1.00
prysm/geth | 26 | 26 | 1.00
lodestar/geth | 67 | 65 | 0.97
lighthouse/erigon | 31 | 27 | 0.87
prysm/erigon | 3 | 2 | 0.67
lodestar/erigon | 1 | 0 | 0.00
```
All CLs have proposed atleast one block with MEV, they all include blobs. We are narrowing down some errors seen in nimbus, but otherwise the MEV workflow looks good.