# dencun-gsf-1 analysis
(Goerli Shadowfork 1).
## Introduction
The shadowfork went live at `December 19, 2023 3:00:00 PM UTC`. The Dencun fork happened on the shadow fork 220 epochs later.
Test setup:
- Goerli shadowfork, capella state
- EIP-4788 deployed on main goerli chain
- Blob spamming
- No TX spamming, natural load from goerli
## Node split
Each node has 100 validators. Each node has 4 vCPUs, 32GB of RAM and ~900GB SSD. The Reth nodes are higher spec due to the need for more disk space (and cloud server choice limitations).
The nodes are distributed across New York, Frankfurt, Bangalore, Sydney regions. Representing 4 continents with significant distance between them and real world latency.
Total number of nodes: 290, following mainnet split (Splitup found on discord [here](https://discord.com/channels/595666850260713488/892088344438255616/1184880807538594013))
We were unable to sync erigon in time for our tests. We will switch to a snapshot approach for erigon in the next shadowfork. Their keys have been re-distributed to other clients.
## Resource usage
The graphs shown are from ~Epoch 150 to ~Epoch 400. This would mean the baseline shadowfork as well as ~16h into the dencun fork.
The Dencun fork occured at 14:30 on the graph. Blob spamming started at 15:50 on the graph.
### Overall CPU/RAM:
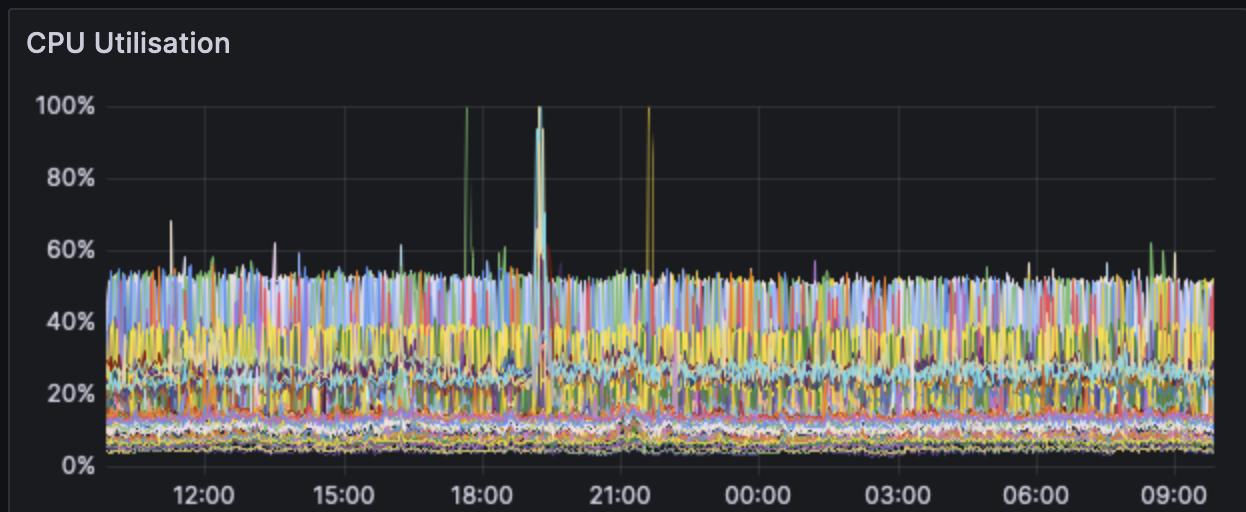
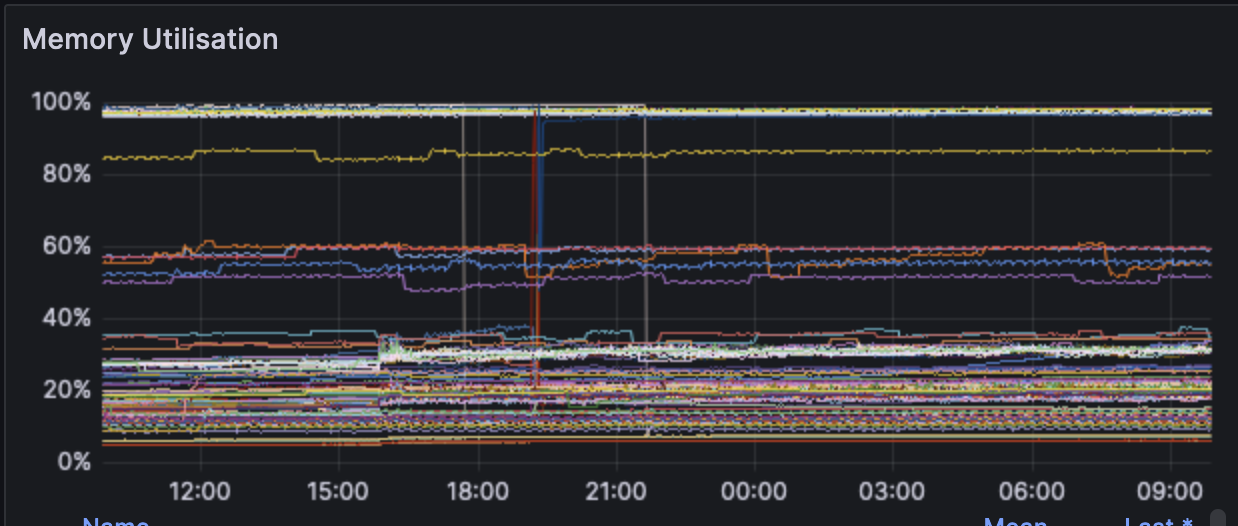
The CPU and RAM across clients don't see any upwards trend. The usage seems to be within margin of error from before and after the fork.
[Link to CPU graph](https://grafana.observability.ethpandaops.io/d/MRfYwus7k/nodes?orgId=1&refresh=1m&var-consensus_client=All&var-execution_client=All&var-network=dencun-gsf-1&var-filter=ingress_user%7C%21%7E%7Csynctest.*&from=1703070377537&to=1703156777537&viewPanel=2)
[Link to RAM graph](https://grafana.observability.ethpandaops.io/d/MRfYwus7k/nodes?orgId=1&refresh=1m&var-consensus_client=All&var-execution_client=All&var-network=dencun-gsf-1&var-filter=ingress_user%7C%21%7E%7Csynctest.*&from=1703070405654&to=1703156805654&viewPanel=9)
### Overall Network use:
The network usage graph is derived from the traffic that is sent and received from the node on its public interface.
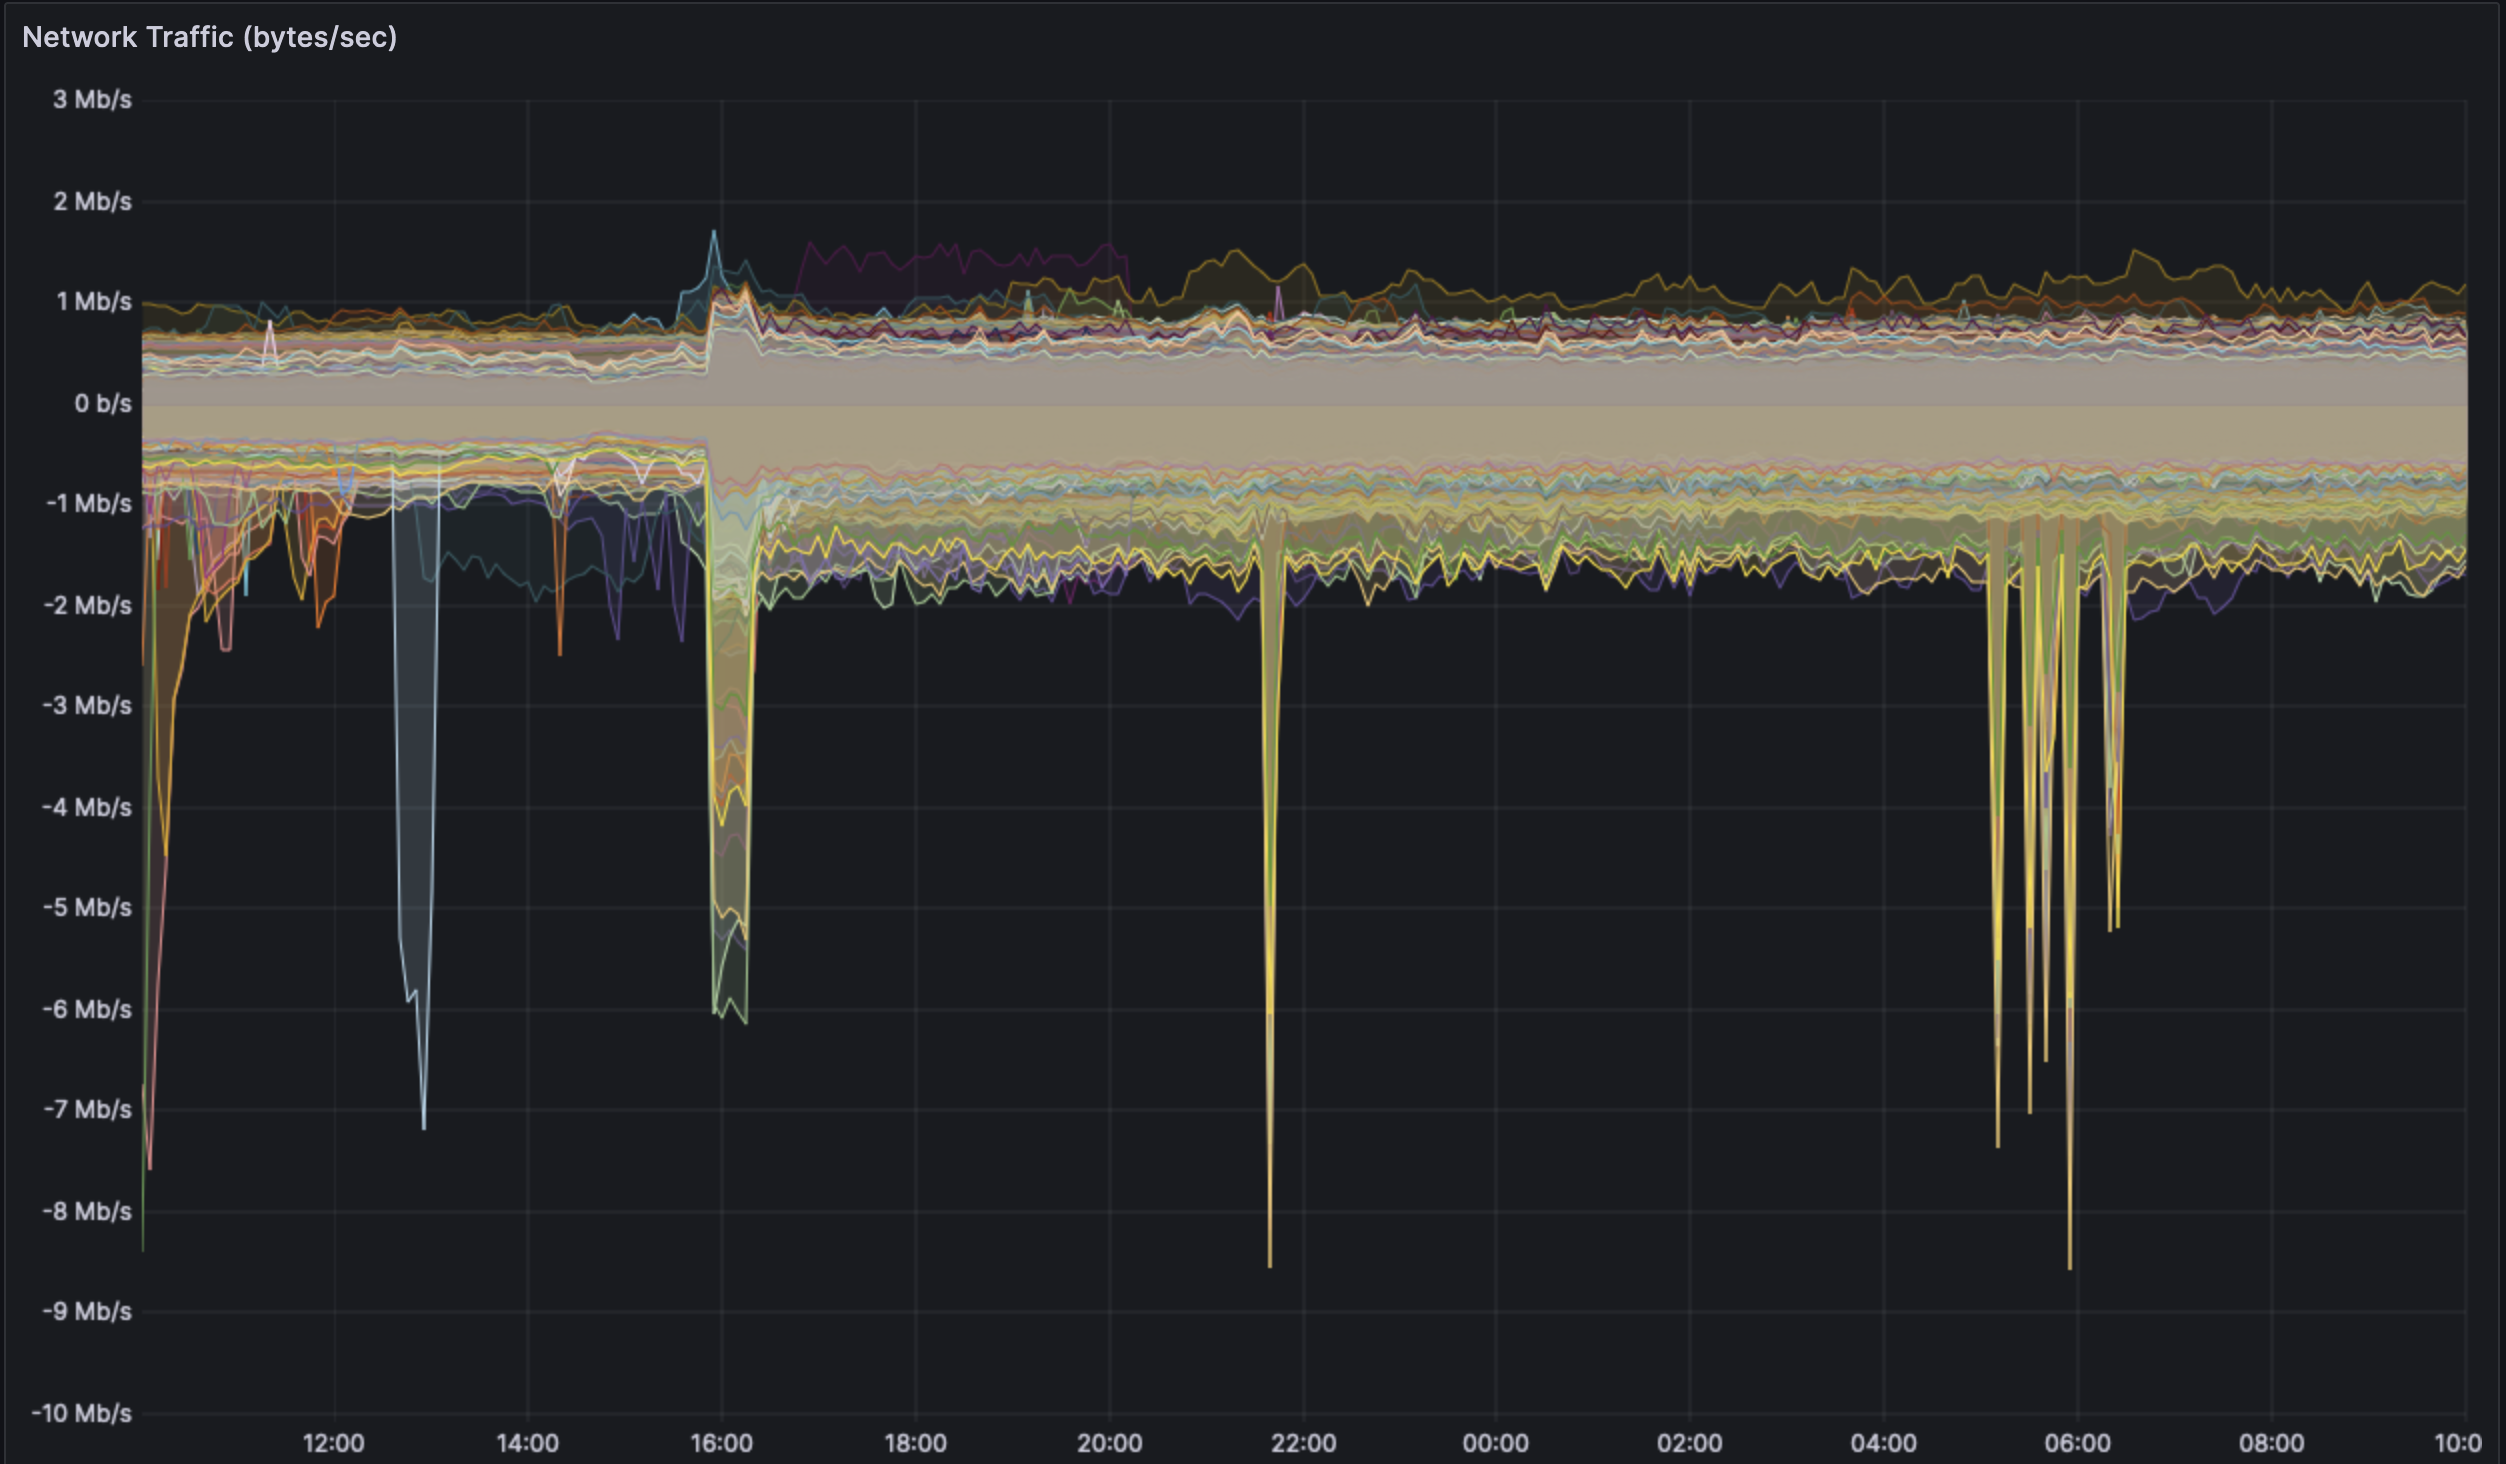
The overall observation is that there is a clear increase in network usage over the baseline shadowfork. We can observe that the shadowfork nodes send ~700 kbps during their cancun operation time. This value is at ~900 kbps during the dencun operation time.
The received traffic has a similar increase. So across the board, one can expect an increase of network use by ~200kbps with a healthy blob usage.
There will be an initial spike at the time blob spamming starts. This is expected as all the mempools would start gossiping and requesting blobs at this time. Once the initial sharing is done, the nodes only need gossip new blobs. This peak would also not be as predominant on a real network as the mempool load is more evenly distrubuted. Our tooling targets ~6 nodes, so they have to "seed" the other ~280 nodes with the data at the start.
Some clients have some unexplained peaks seen at 21:00 and 6:00. This seems to correspond to reth and the team would have to investigate what the trigger is.
[Link to network graph](https://grafana.observability.ethpandaops.io/d/MRfYwus7k/nodes?orgId=1&refresh=1m&var-consensus_client=All&var-execution_client=All&var-network=dencun-gsf-1&var-filter=ingress_user%7C%21%7E%7Csynctest.*&from=1703070420738&to=1703156820738&viewPanel=17)
### Overall Network health:
Phenomenally stable and healthy network. There were no clients struggling and every client pair has proposed blocks and is attesting.
## Blob analysis:
Blob data was collected using [Xatu](https://notes.ethereum.org/@ethpandaops/xatu-overview) targeting the event stream of (4 each) teku, prysm, lodestar nodes and lighthouse nodes. We could not get Nimbus data at this time as they aren't supporting the blob_sidecar event yet. The sentries are placed in NYC, FRA, BLR and SYD regions, covering most of the world and representing real latency.
Since we are analysing blobs, the analysis timeframe would be from Epoch ~280 till Epoch ~400.
In this timeframe, there were ~57,000 blocks ingested and 135,000 blobs analysed.
Another point to note is that since the network is relatively small compared to mainnet and all the nodes are publically accessible, we would see quite a flat peering structure. i.e, Most nodes would peer with some node in the other regions. In a real world network you could imagine some amount of emergent clustering.
#### Blob distribution
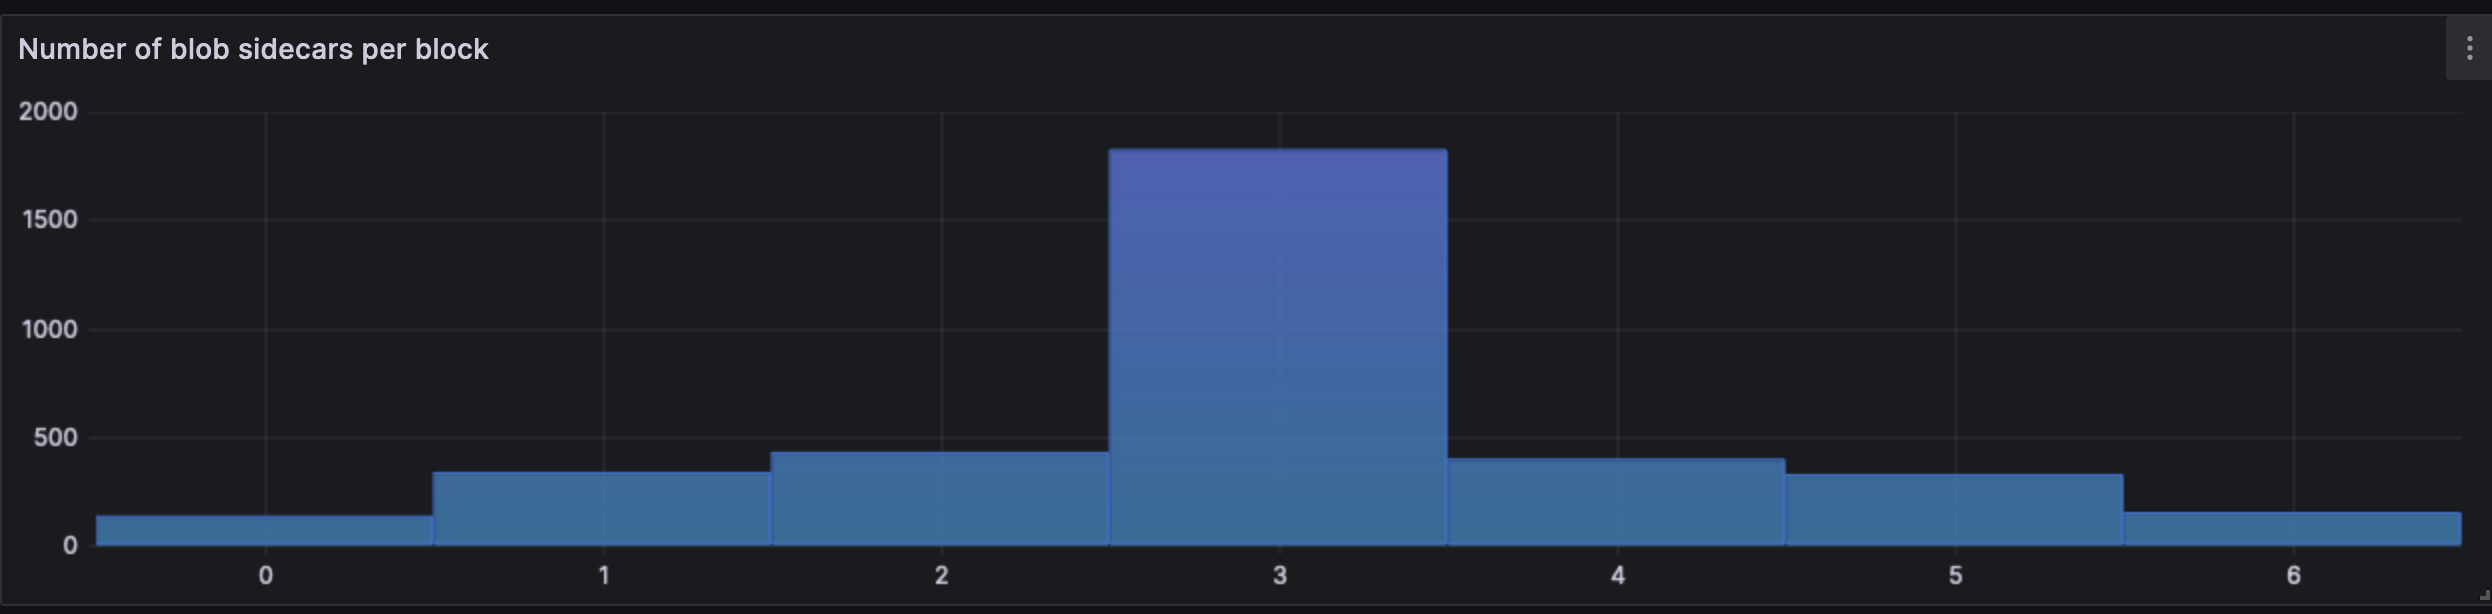
In the analysis timeperiod, most blocks contained 3 blobs. Since this is the target, we would likely see such behaviour in mainnet as well.
[Link to blob distribution graph](https://grafana.observability.ethpandaops.io/d/be15cc56-e151-4268-8772-f4a9c6a4e246/blobs?orgId=1&var-network_name=dencun-gsf-1&var-client_name=All&var-consensus_implementation=All&var-consensus_version=All&var-geo_continent_code=All&var-heatmap_interval=250&var-interval_tight=%24__auto_interval_interval_tight&var-interval=%24__auto_interval_interval&var-interval_loose=%24__auto_interval_interval_loose&from=1703153260855&to=1703156860855&viewPanel=345)
#### Blob propagation
Average propagation time:
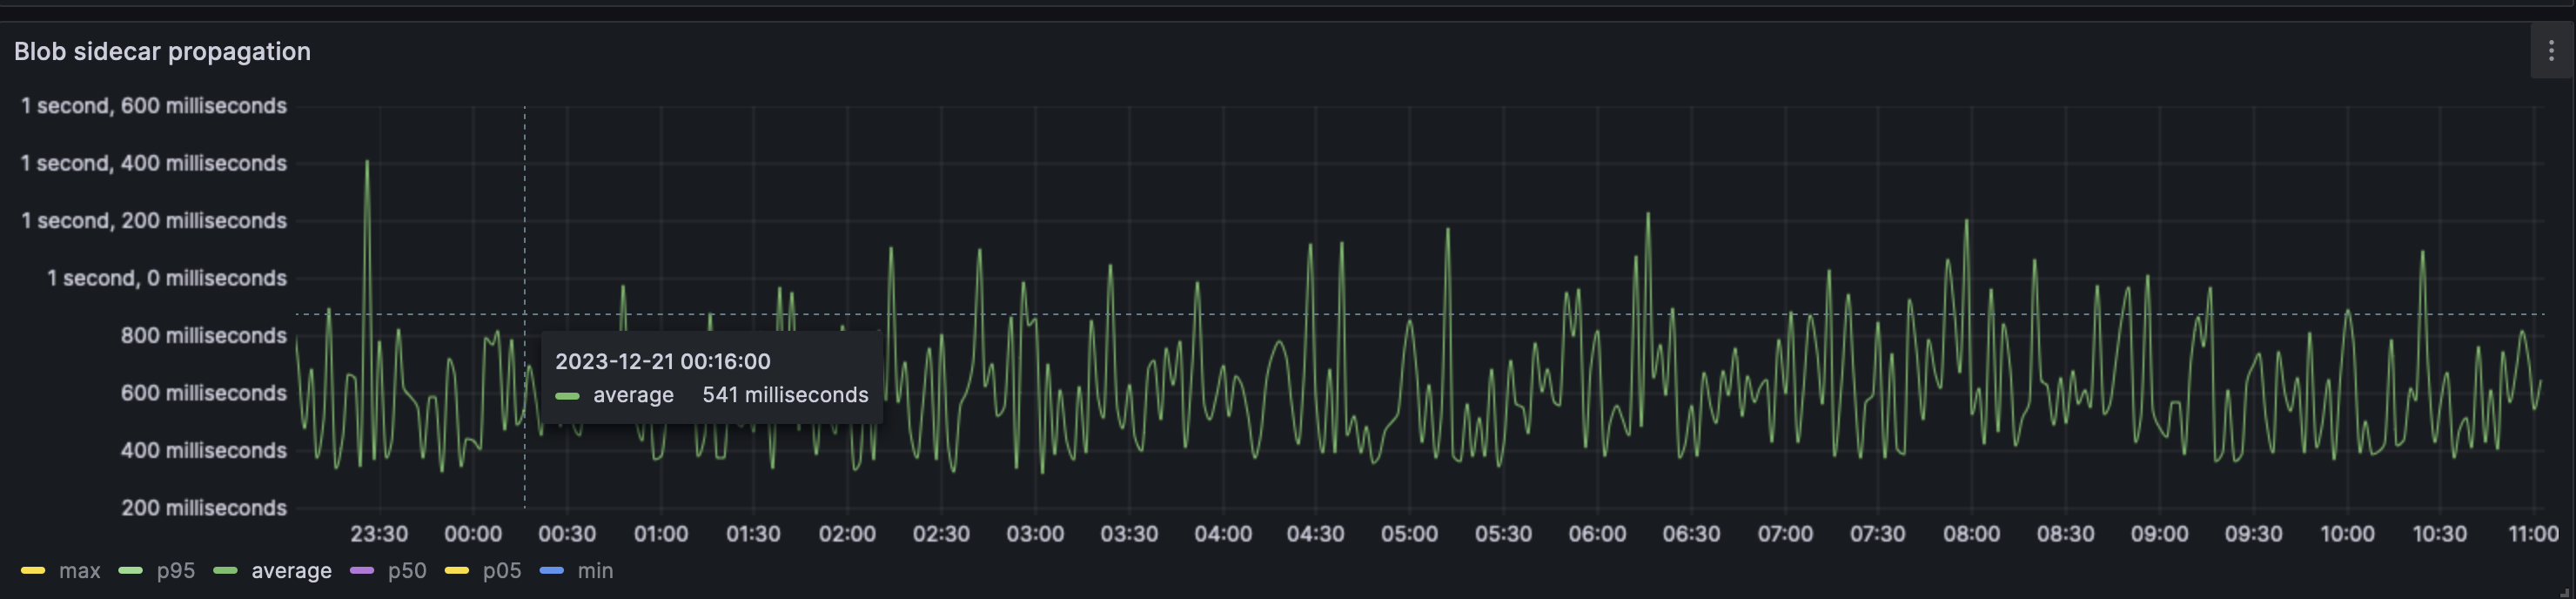
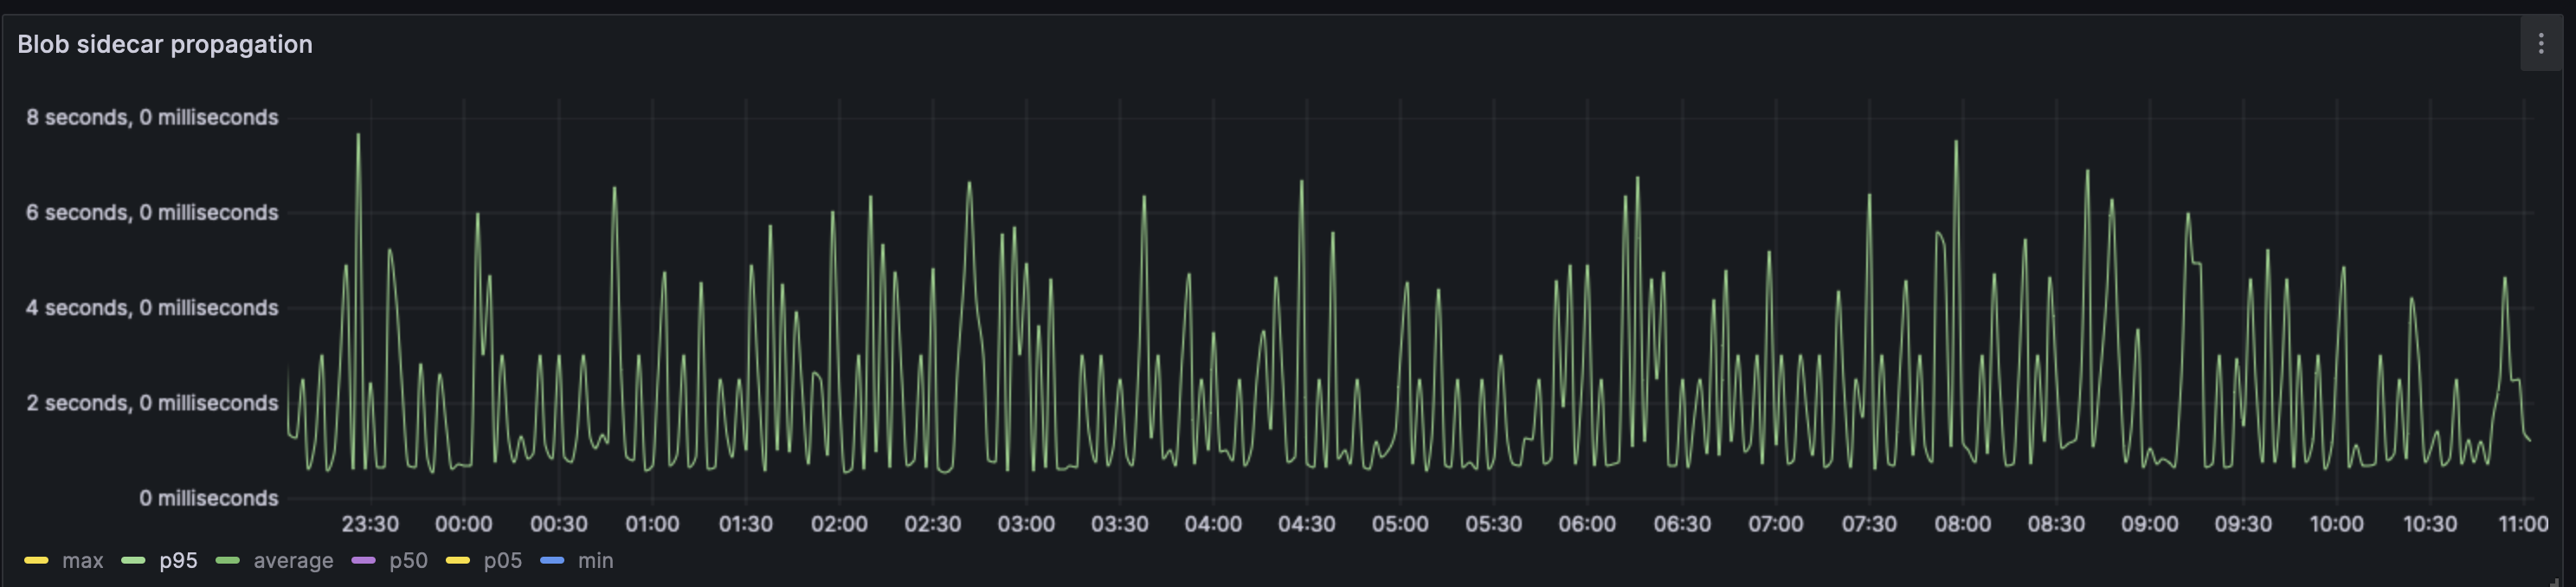
The average blob sidecar was propagated across 95% of the nodes in <2s. There are however recurring peaks, with the longest propagation time being 8s. On average the peaks do not exceed 2s. One must note that this is the p95 value and not the average. The average case has most of the blobs being propagated across the network in under 500ms.
[Link to blob propagation graph](https://grafana.observability.ethpandaops.io/d/be15cc56-e151-4268-8772-f4a9c6a4e246/blobs?orgId=1&var-network_name=dencun-gsf-1&var-client_name=All&var-consensus_implementation=All&var-consensus_version=All&var-geo_continent_code=All&var-heatmap_interval=250&var-interval_tight=%24__auto_interval_interval_tight&var-interval=%24__auto_interval_interval&var-interval_loose=%24__auto_interval_interval_loose&viewPanel=184&from=1703153287506&to=1703156887506)
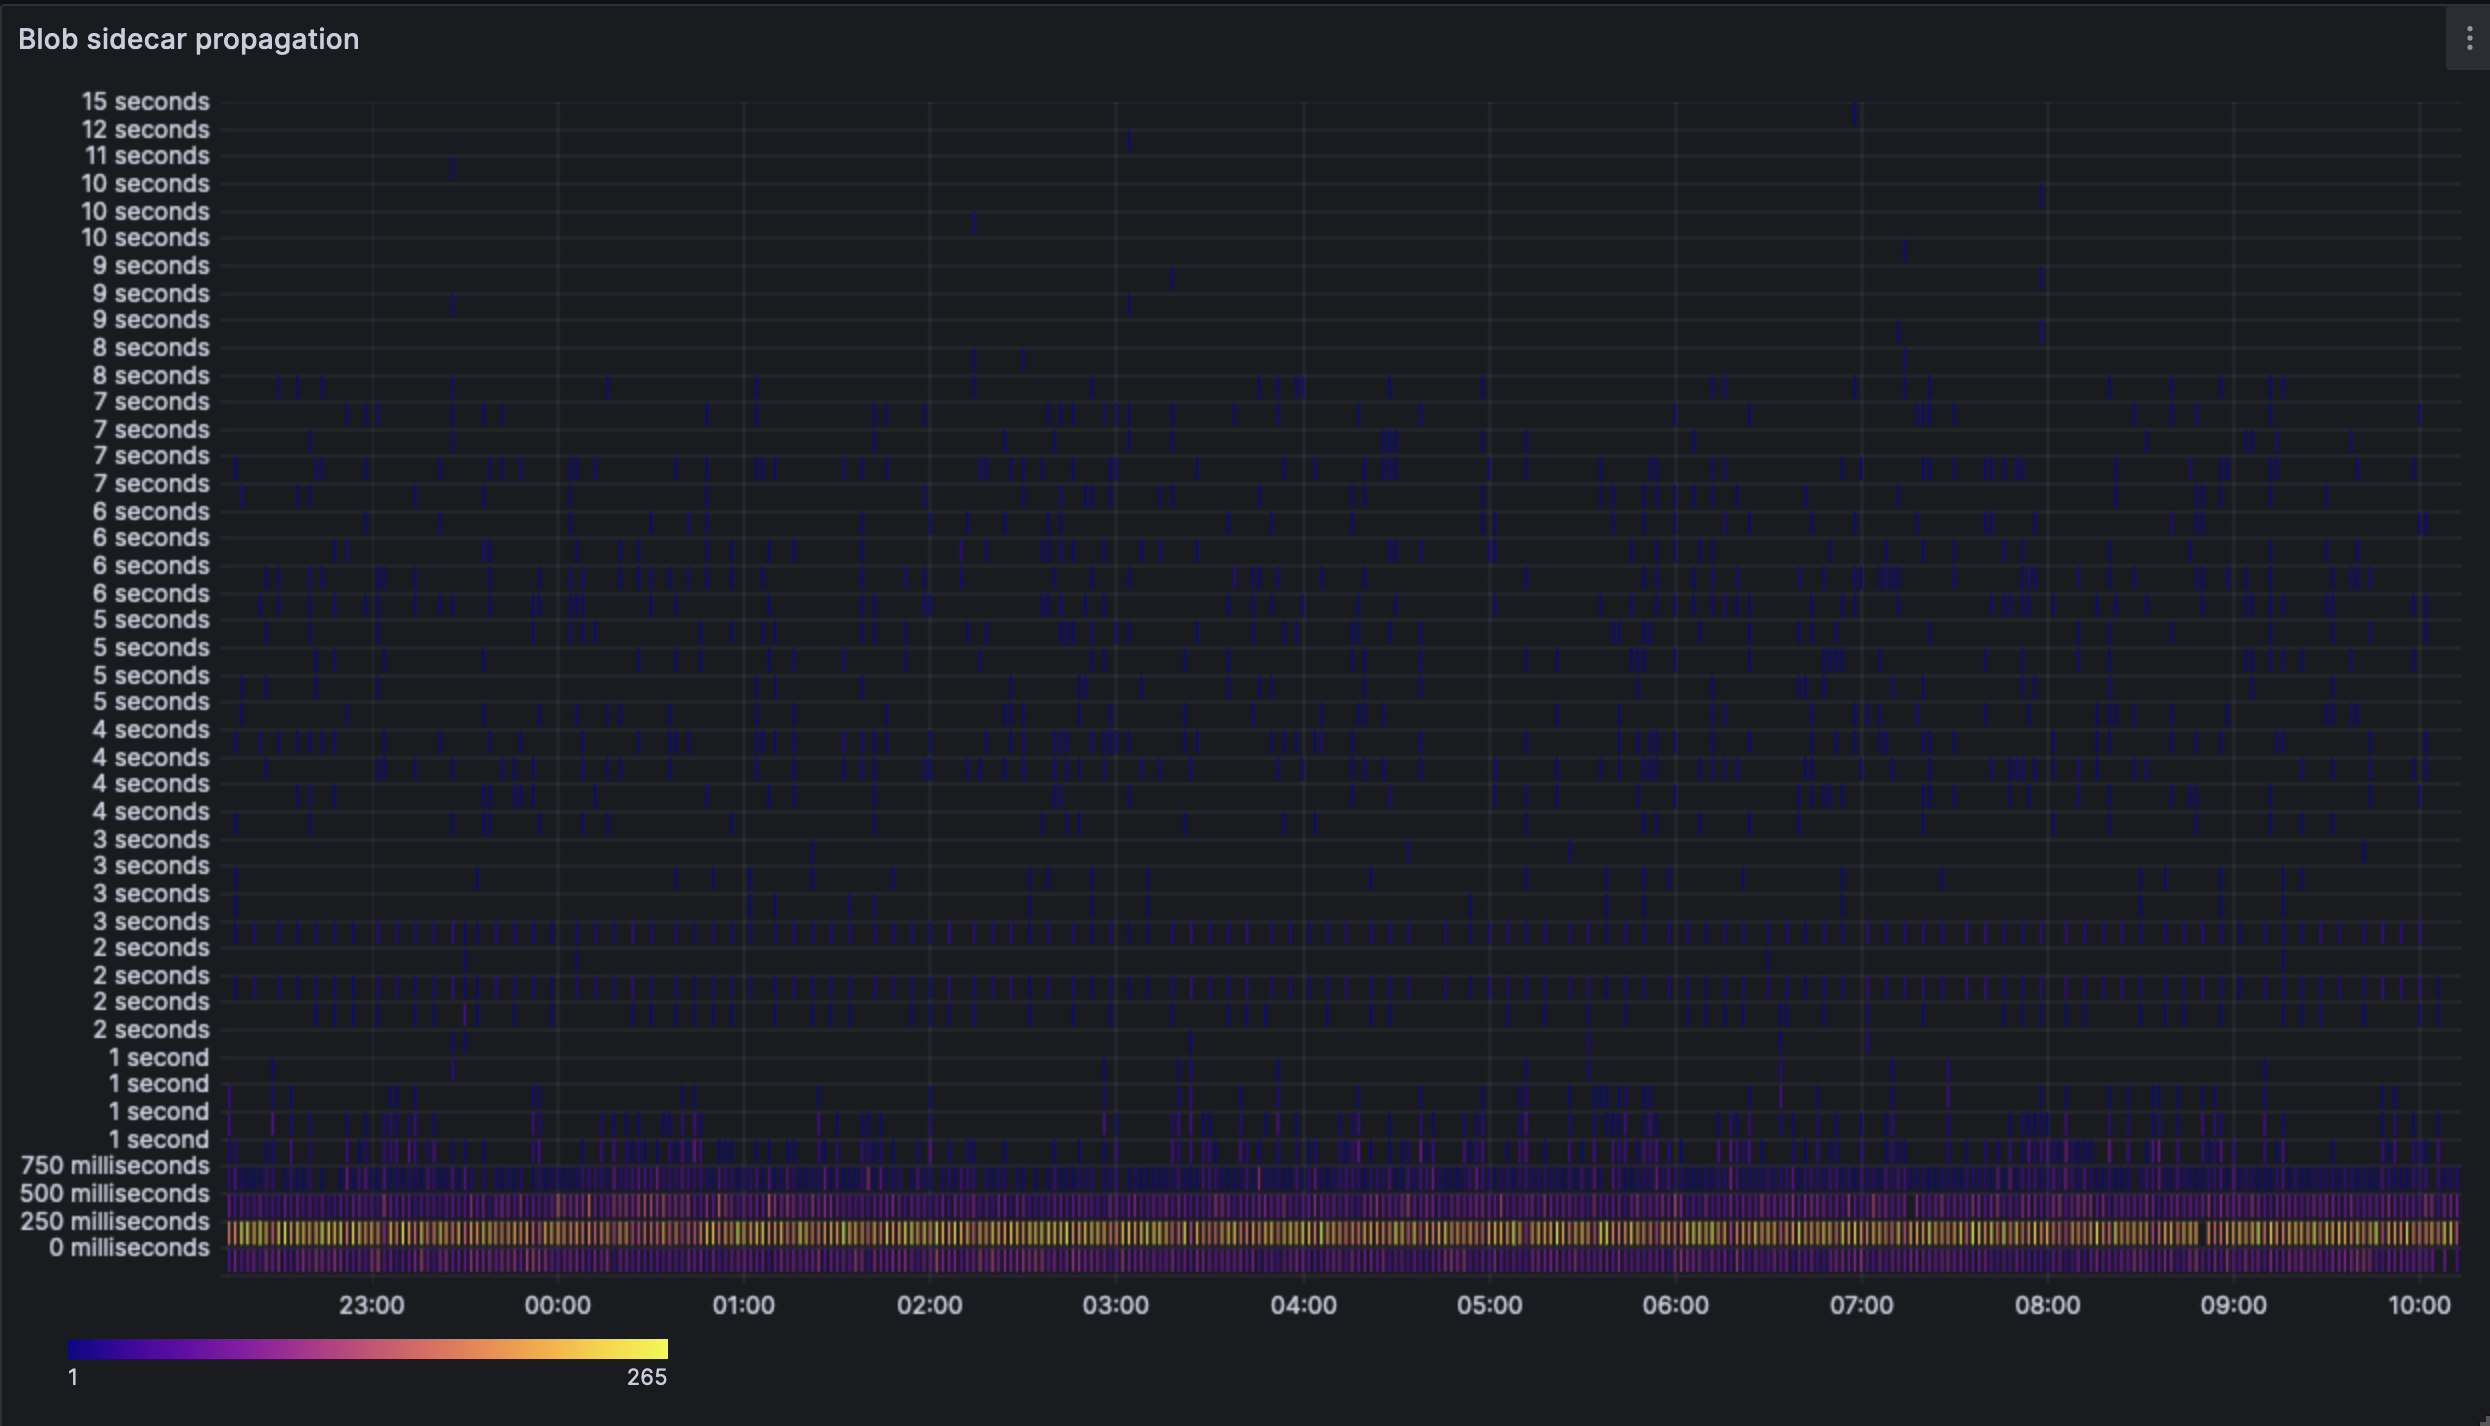
The heatmap showcases the average case and outliers quite well. It would be quite expected that the nodes in Sydeney would not receive the blobs in <250ms (most of the time) due to real world latency and routing.
[Link to blob heatmap](https://grafana.observability.ethpandaops.io/d/be15cc56-e151-4268-8772-f4a9c6a4e246/blobs?orgId=1&from=1703113742374&to=1703156942374&var-network_name=dencun-gsf-1&var-client_name=All&var-consensus_implementation=All&var-consensus_version=All&var-geo_continent_code=All&var-heatmap_interval=250&var-interval_tight=%24__auto_interval_interval_tight&var-interval=%24__auto_interval_interval&var-interval_loose=%24__auto_interval_interval_loose&viewPanel=185)
#### Blob propagation vs no. of Blobs in block
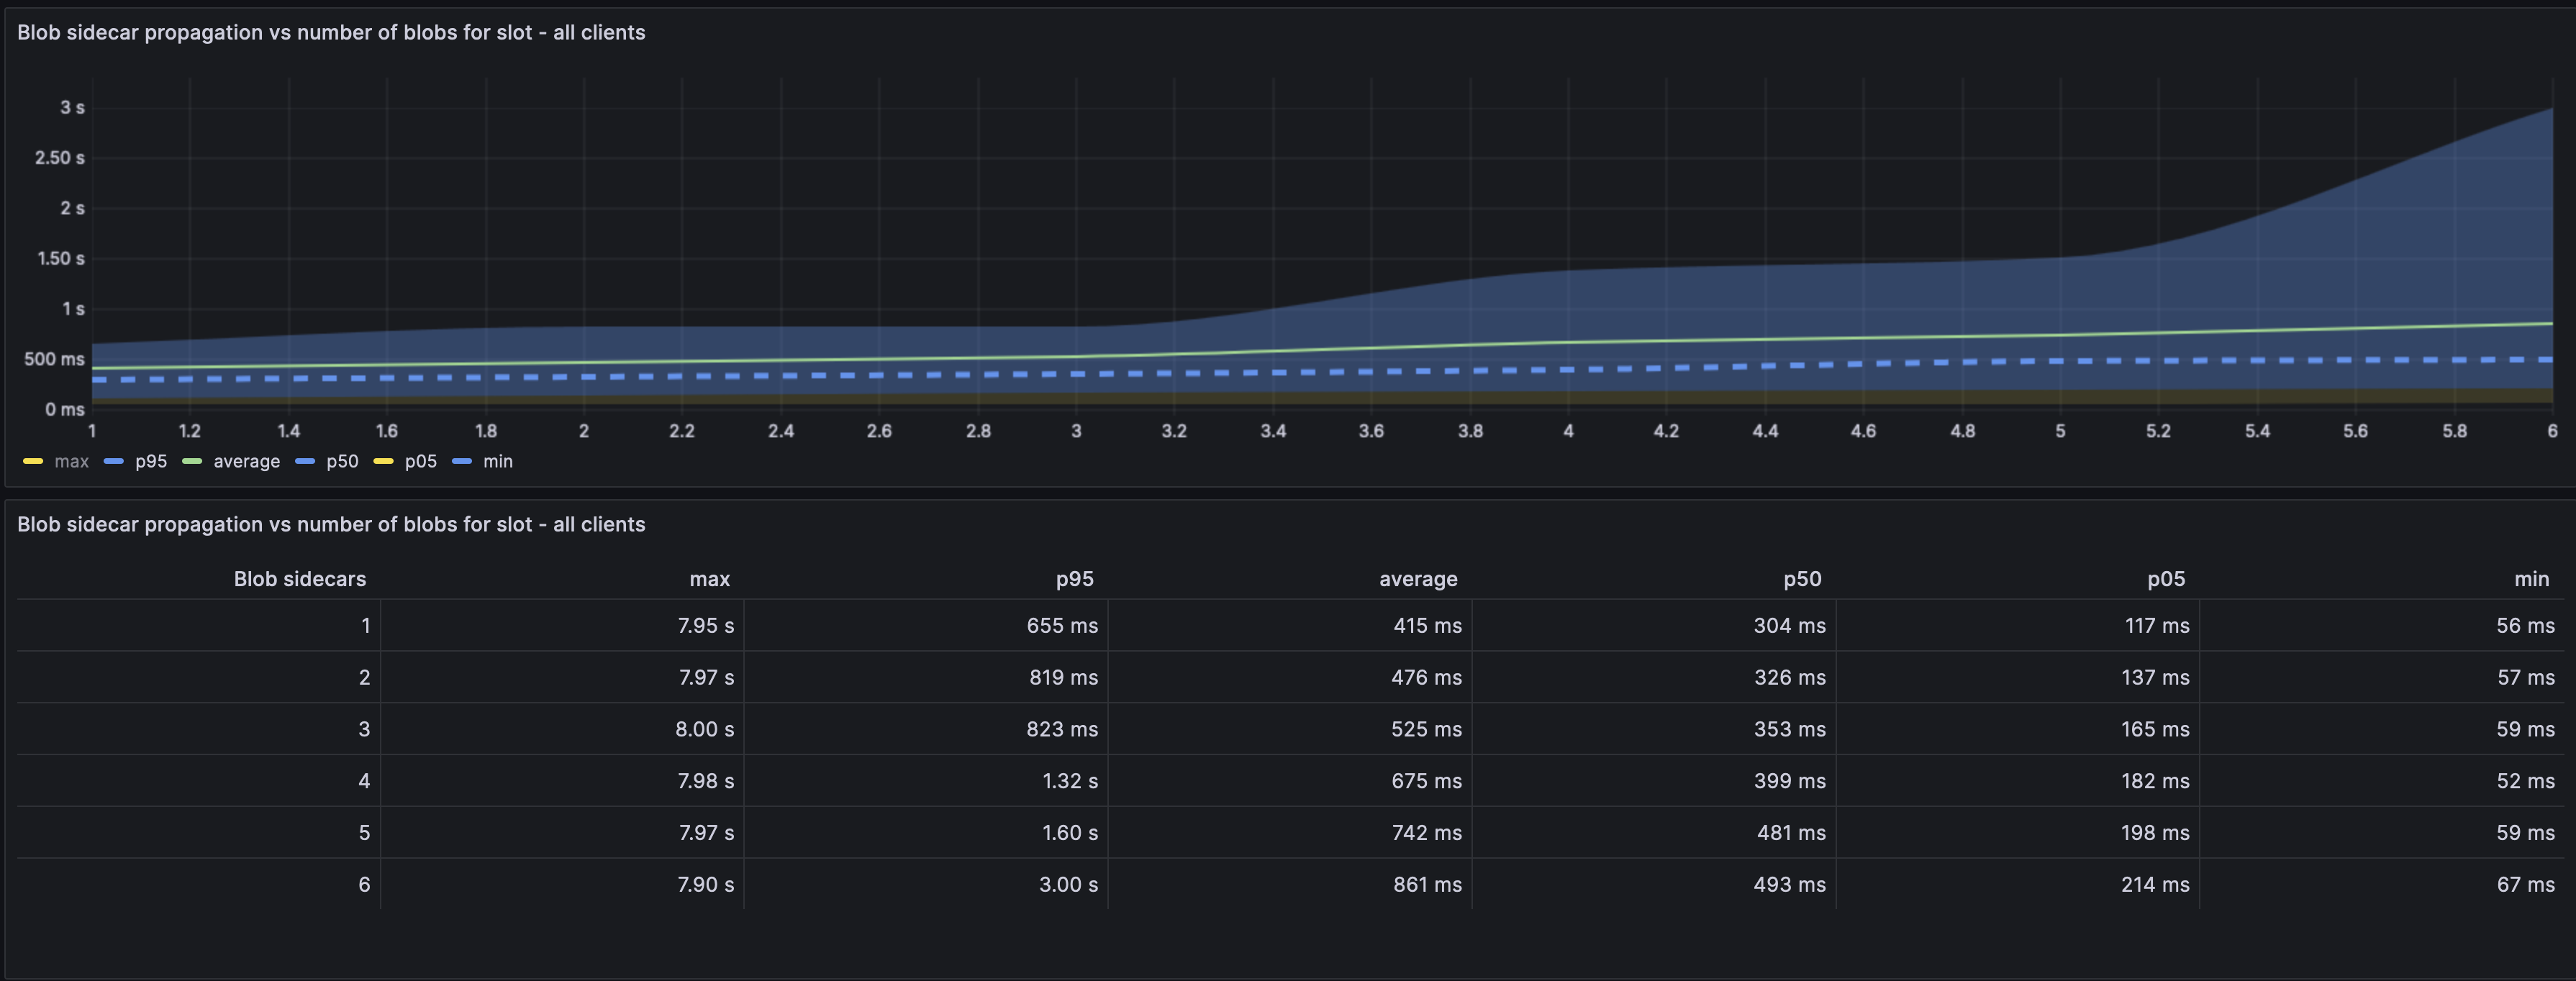
The graph represents how long the blob takes to propagate depending on how many blobs there are in a slot. i.e, If there was 1 blob we would see it being propagated faster than if we are saturated at 6 blobs.
The average case shows a 400ms delay in 1 blob vs 6 blobs. The p95 case shows a 2.4s difference between 1 vs 6 blobs.
[Link to graph](https://grafana.observability.ethpandaops.io/d/be15cc56-e151-4268-8772-f4a9c6a4e246/blobs?orgId=1&from=1703113765741&to=1703156965741&var-network_name=dencun-gsf-1&var-client_name=All&var-consensus_implementation=All&var-consensus_version=All&var-geo_continent_code=All&var-heatmap_interval=250&var-interval_tight=%24__auto_interval_interval_tight&var-interval=%24__auto_interval_interval&var-interval_loose=%24__auto_interval_interval_loose&viewPanel=195)
#### Block propagation vs no. of Blobs in block
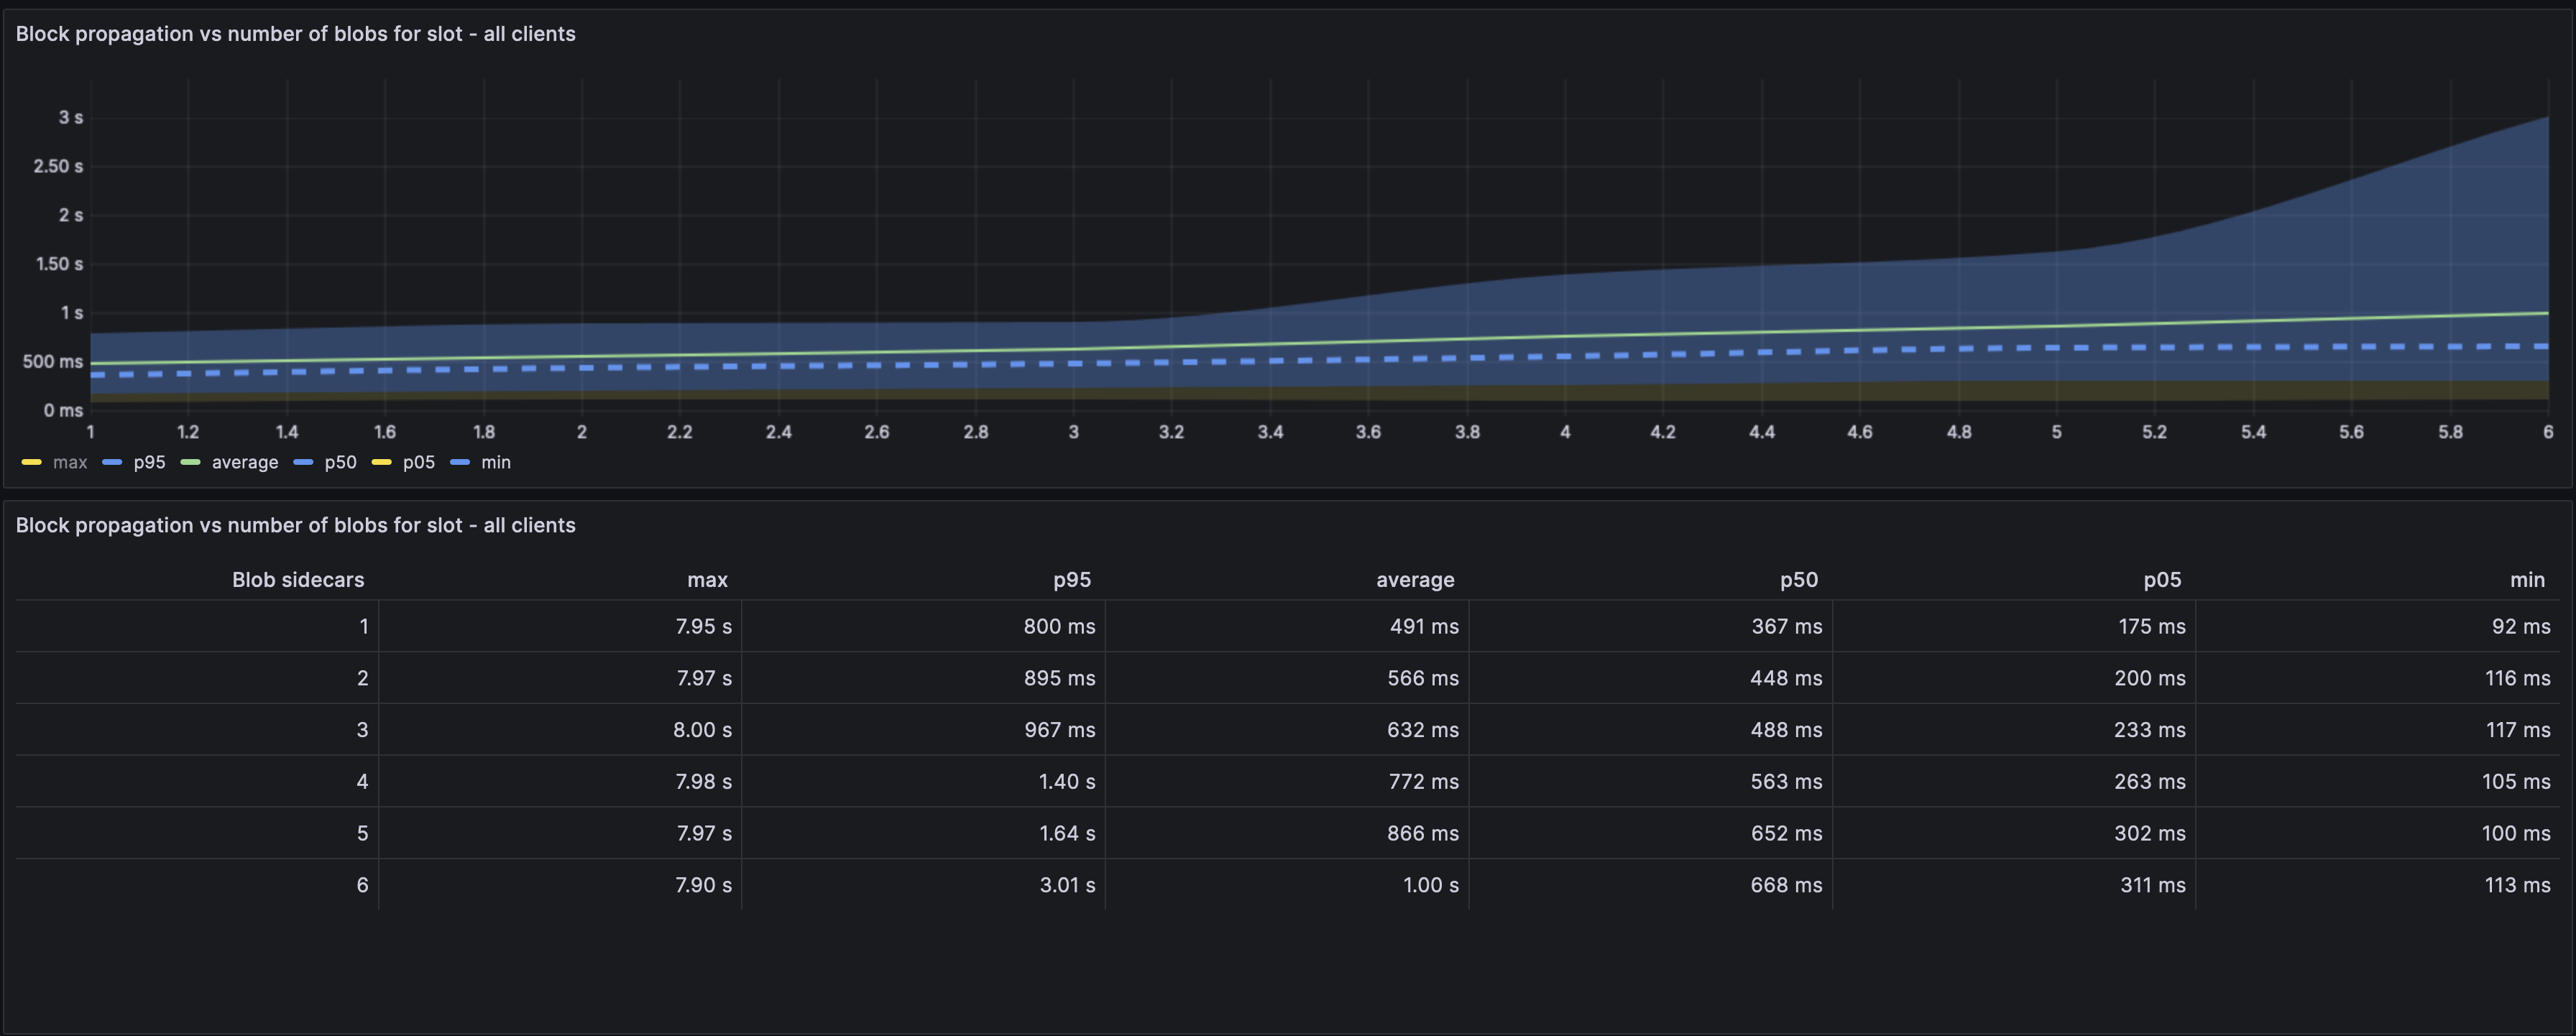
**Caveat**: This metric is likely skewed and would partially depend on if a CL emits the block event after blob verification or not. i.e, It would not say it received a block until fetching all the blobs, so the blob latency sets the bounds.
The block propagation also seems similarly affected by the presence of more blobs. The average case difference is higher here, we see that on average there's a 500ms latency addition when there are 6 blobs vs 1 blob.
[Link to graph](https://grafana.observability.ethpandaops.io/d/be15cc56-e151-4268-8772-f4a9c6a4e246/blobs?orgId=1&from=1703113782358&to=1703156982358&var-network_name=dencun-gsf-1&var-client_name=All&var-consensus_implementation=All&var-consensus_version=All&var-geo_continent_code=All&var-heatmap_interval=250&var-interval_tight=%24__auto_interval_interval_tight&var-interval=%24__auto_interval_interval&var-interval_loose=%24__auto_interval_interval_loose&viewPanel=217)
#### Time from first blob to last
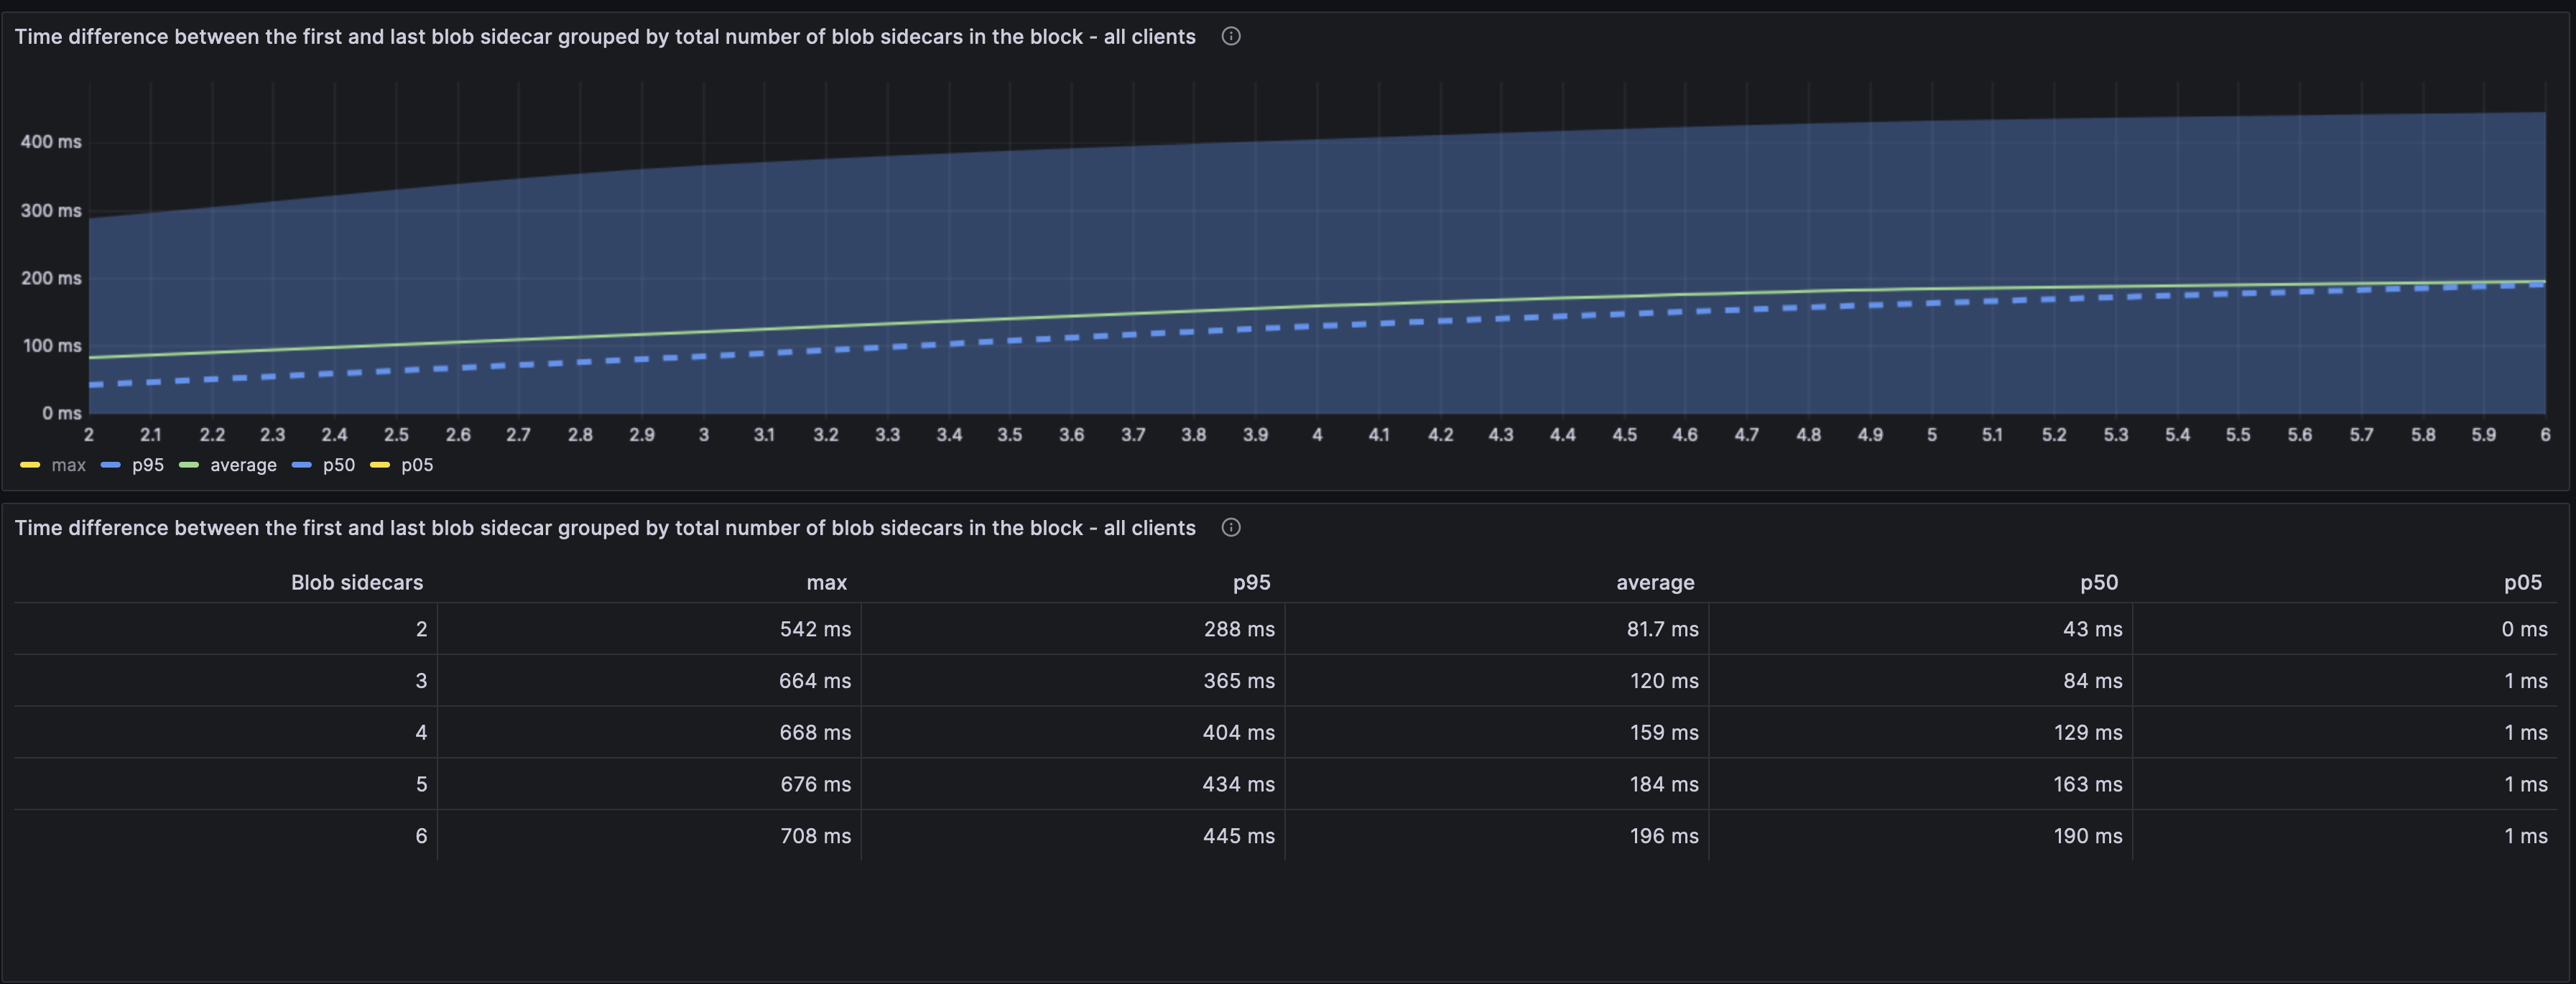
**Caveat**: This metric is likely skewed due to the flat network structure we have where the same nodes get seeded with the blobs.
Once the blobs have been first seen, the difference from the first to the last is not that high. We only see a ~100ms difference between the two.
[Link to graph](https://grafana.observability.ethpandaops.io/d/be15cc56-e151-4268-8772-f4a9c6a4e246/blobs?orgId=1&from=1703113808308&to=1703157008308&var-network_name=dencun-gsf-1&var-client_name=All&var-consensus_implementation=All&var-consensus_version=All&var-geo_continent_code=All&var-heatmap_interval=250&var-interval_tight=%24__auto_interval_interval_tight&var-interval=%24__auto_interval_interval&var-interval_loose=%24__auto_interval_interval_loose&viewPanel=231)
### Block/Attestation analysis:
#### Block propagagation
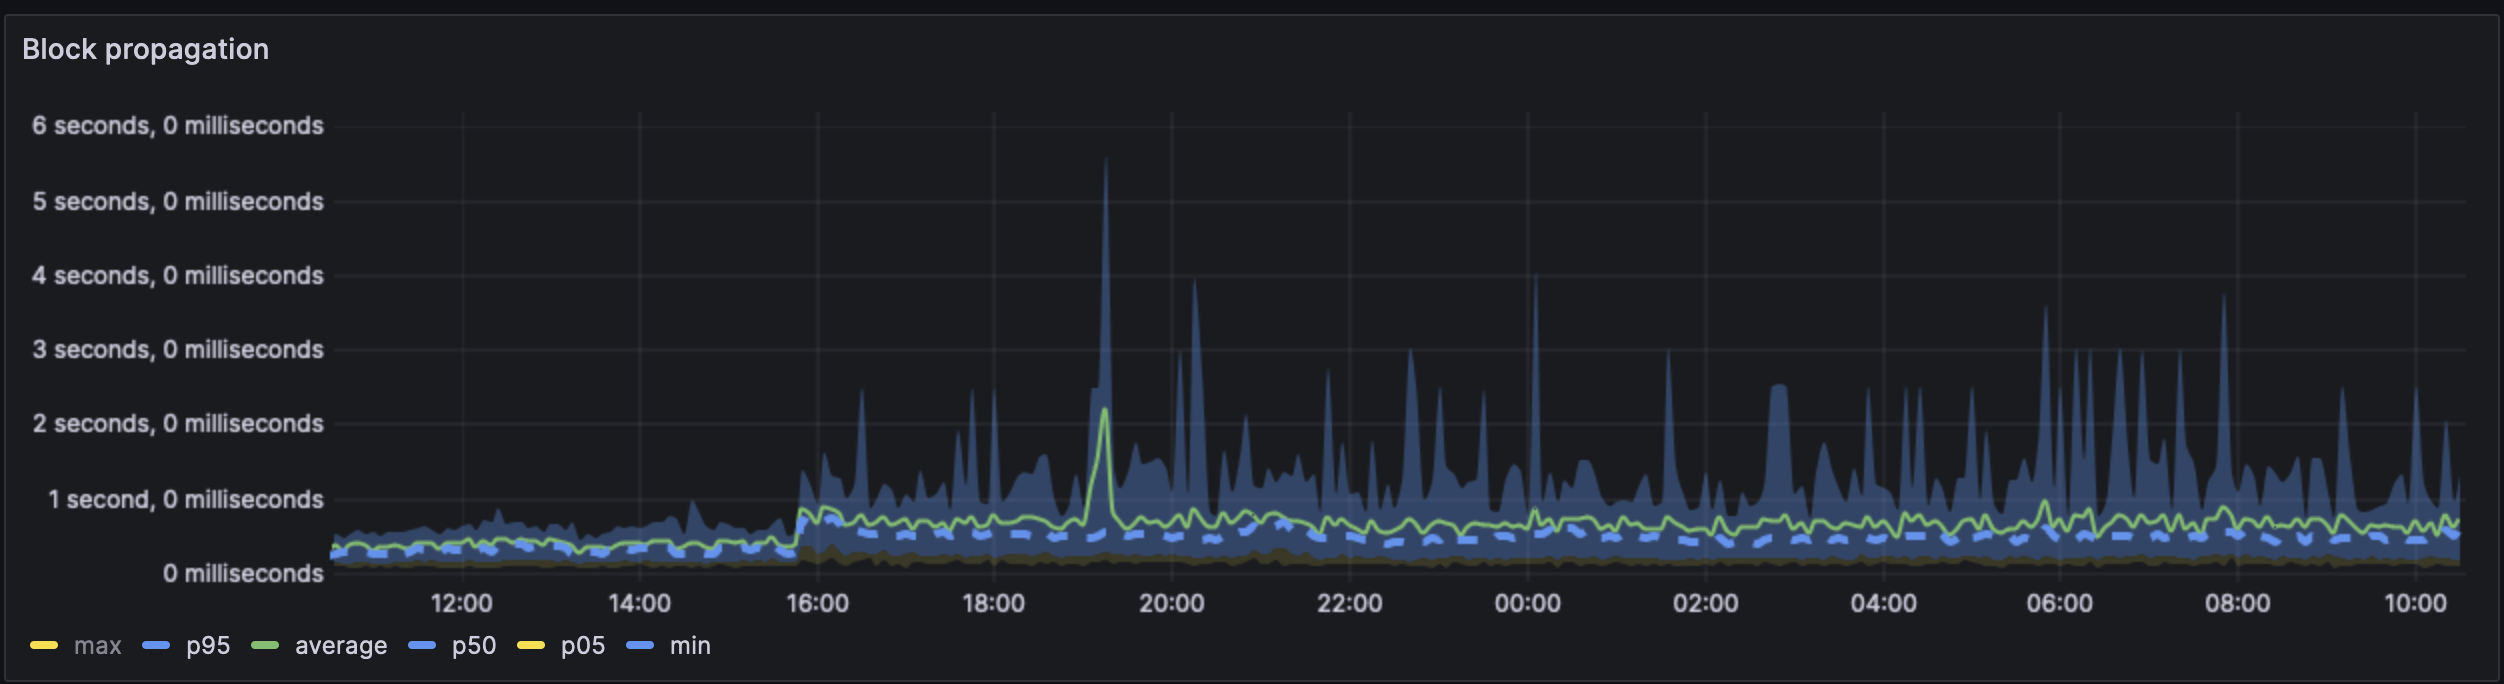
We can see a clear uptick once the blob spamming starts at ~15:50. The average block propagation time went from ~350ms to 700ms. The peaks are also far more more varied, indicating that in the worst case
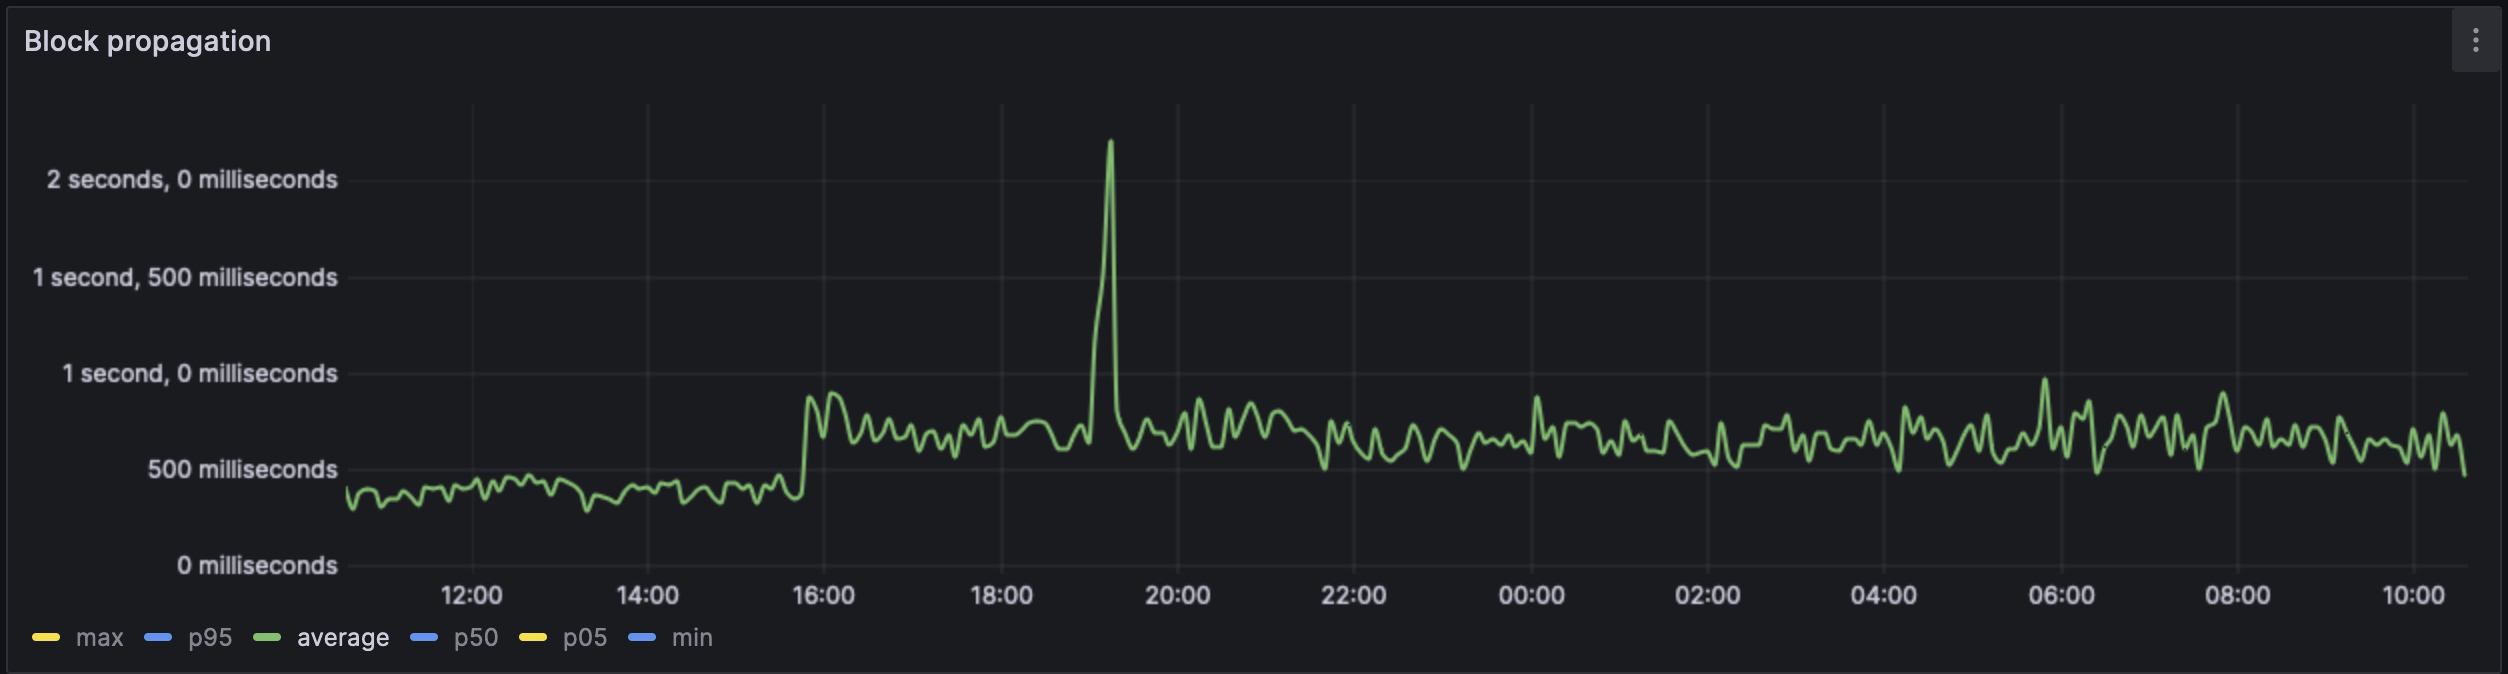
The spike is extremely visible in the average case. The increase of ~250ms is what is expected in the average best case.
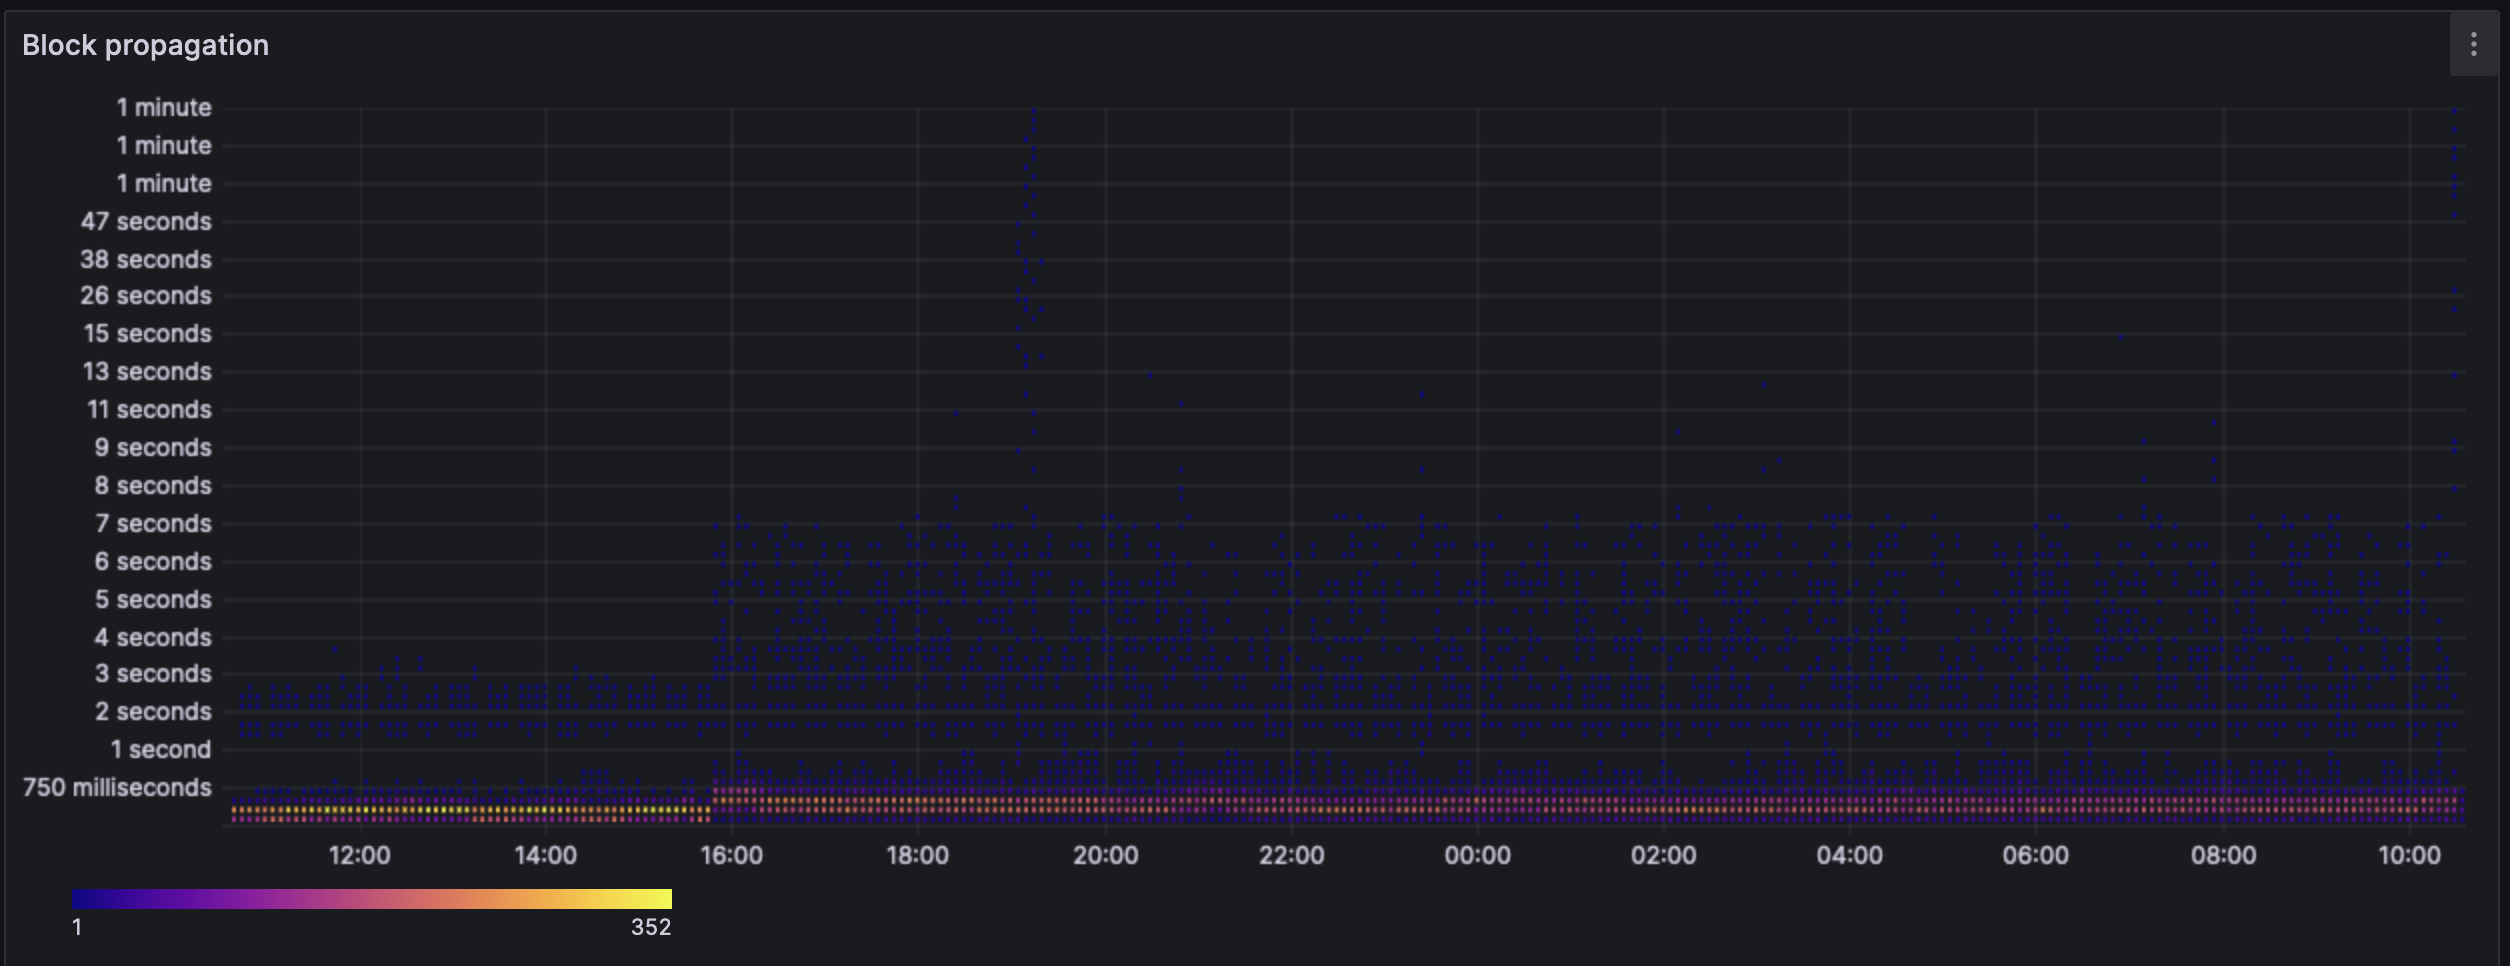
The heatmap shows us a similar story. During cancun/pre-blobs the heatmap is strongest at 250ms with the widest cases being at the 3s mark. Post blobs, the heatmap shows strongest block propagation at the 250ms-1s mark (evenly spread) and the widest cases being ~7s.
[Link to graph](https://grafana.observability.ethpandaops.io/d/MR_U64N4k/beacon-api-events?orgId=1&var-network_name=dencun-gsf-1&var-client_name=All&var-consensus_implementation=All&var-consensus_version=All&var-geo_continent_code=All&var-heatmap_interval=250&var-interval_tight=%24__auto_interval_interval_tight&var-interval=%24__auto_interval_interval&var-interval_loose=%24__auto_interval_interval_loose&var-table_prefix=&var-attestation_prefix=&from=1703153435092&to=1703157035092&viewPanel=36)
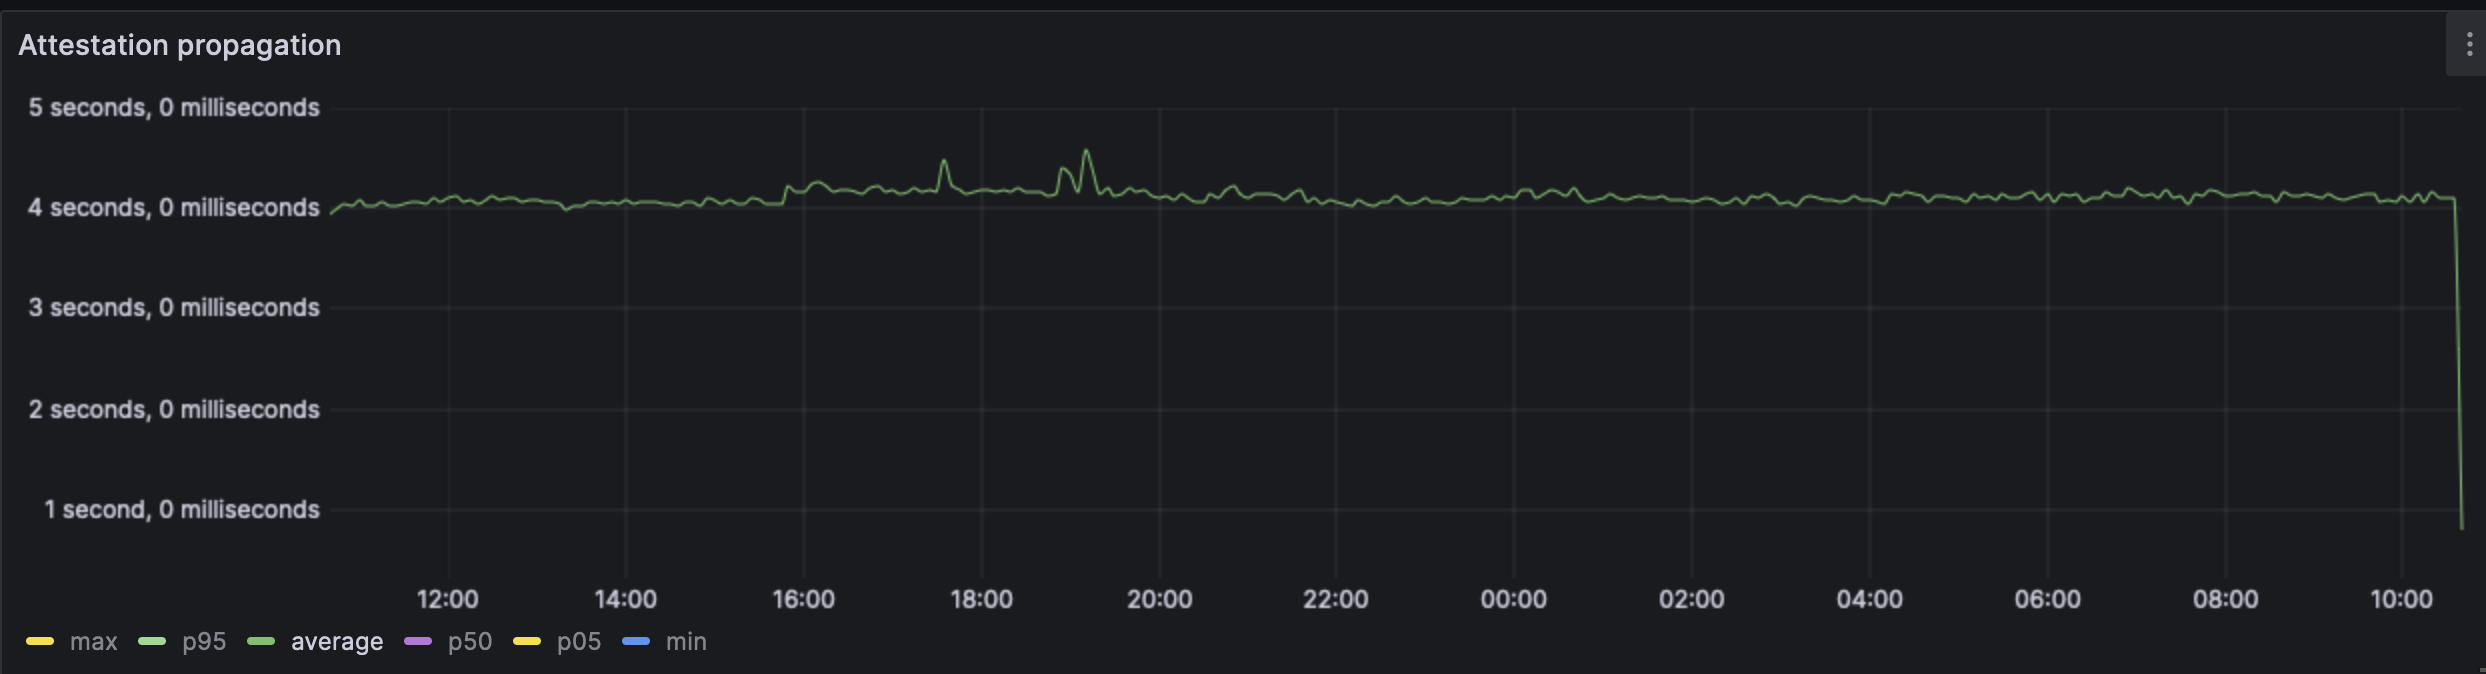
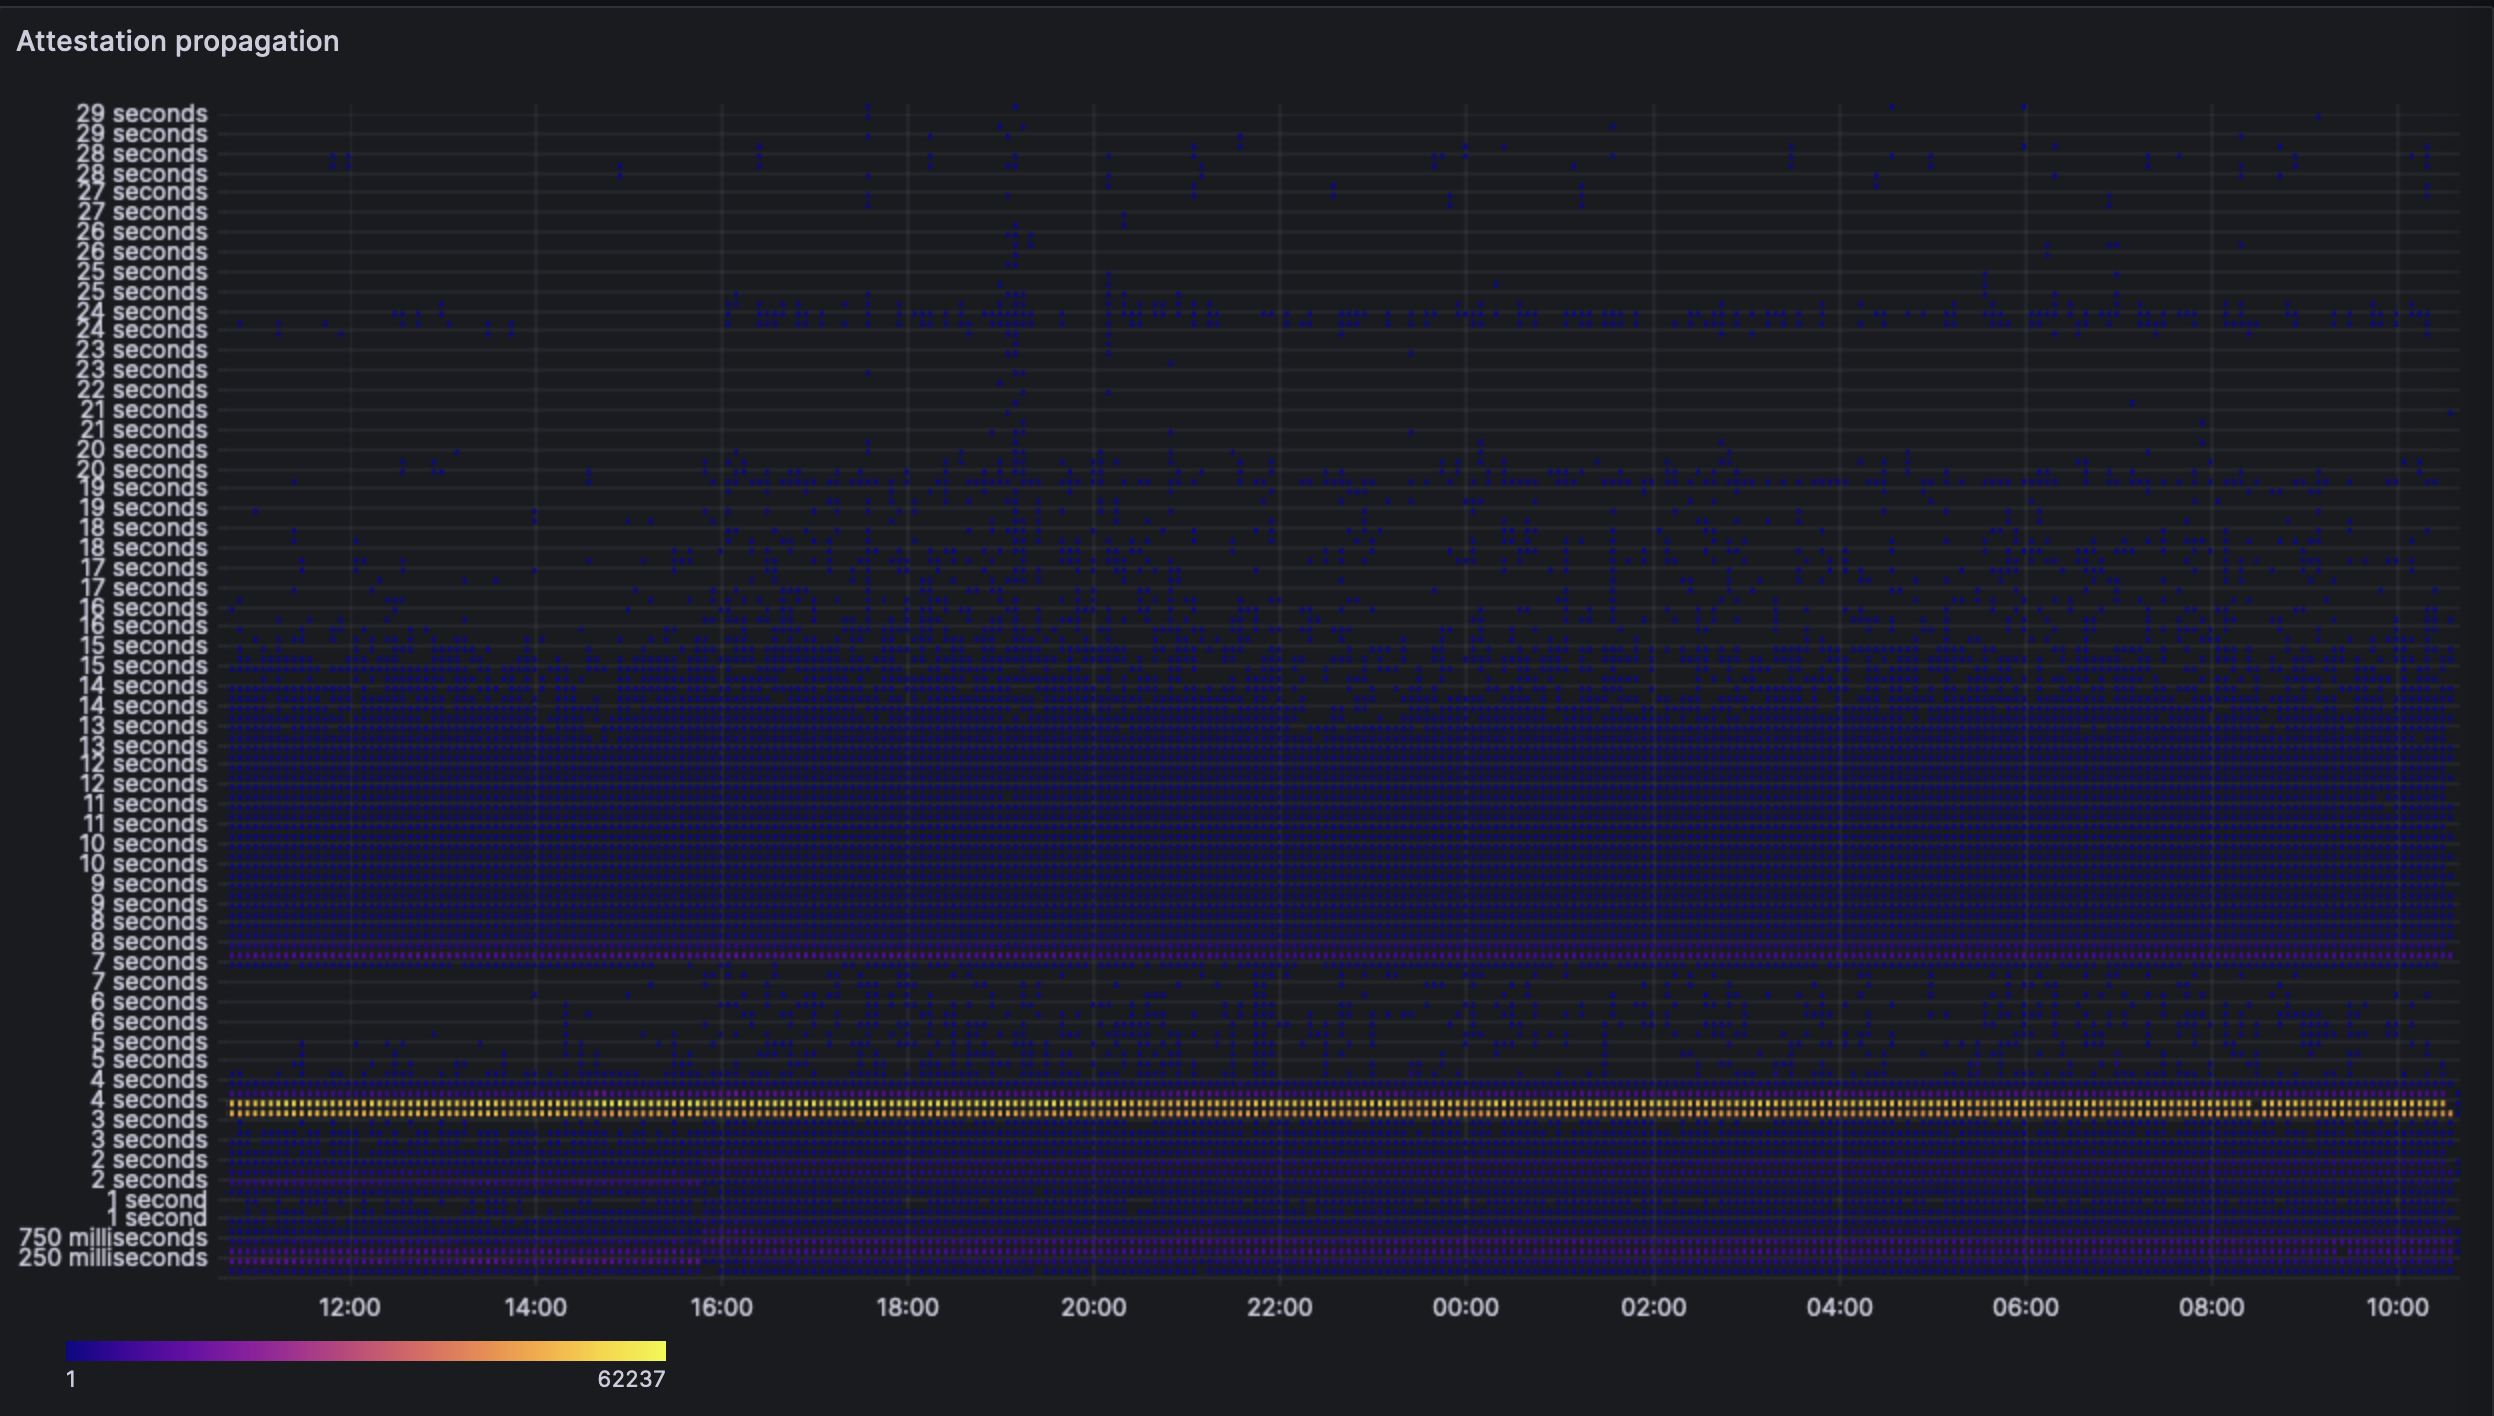
The attestations seem unaffected. They are still able to perform their function as expected without any effect of the blobs. There is some increase in the outliers. This is probably as most clients perform attestations at the 4s mark and all other stats seem to indicate that the nodes are receiving all the data they need by then - so there's no real reason for a delay to show up in attestations.
[Link to graph](https://grafana.observability.ethpandaops.io/d/MR_U64N4k/beacon-api-events?orgId=1&var-network_name=dencun-gsf-1&var-client_name=All&var-consensus_implementation=All&var-consensus_version=All&var-geo_continent_code=All&var-heatmap_interval=250&var-interval_tight=%24__auto_interval_interval_tight&var-interval=%24__auto_interval_interval&var-interval_loose=%24__auto_interval_interval_loose&var-table_prefix=&var-attestation_prefix=&from=1703153454976&to=1703157054976&viewPanel=75)
### Reorgs
No re-orgs were observed on the network during the entire period of operation.