# dencun-devnet-10 stress test
## Introduction
Dencun-devnet-10 baseline metrics can be found [here](https://notes.ethereum.org/@ethpandaops/dencun-devnet-10-analysis). Once we collected ~1 day worth of data with 1-4 blobs being mostly propagated, we started the spammer. This led to most slots containing 6 blobs and would represent a stressed network.
We additionally added the blobber to cause some invalid message passing on the gossip layer. Blobber will send two messages for a proposal, one valid and one invalid and gossip it across multiple beacon nodes that it is connected to.
## Node split
Unchanged from baseline.
## Resource usage
**Note: All graph times are in CEST and are collected from Oct 25th, 12PM CEST till Oct 26th, 12PM CEST. The spamming started at ~6PM CEST, roughly halfway.
**
We have a new CPU/RAM graph that allows for easier filtering and grouping, found [here](https://grafana.observability.ethpandaops.io/d/bdf1e4d6-4030-4614-908b-6e78703fcaee/el-cl-process-usage?orgId=1&from=now-24h&to=now&var-network=dencun-devnet-10&var-consensus_client=prysm&var-execution_client=All&var-jobs=execution&var-jobs=consensus_node)
### Overall CPU:
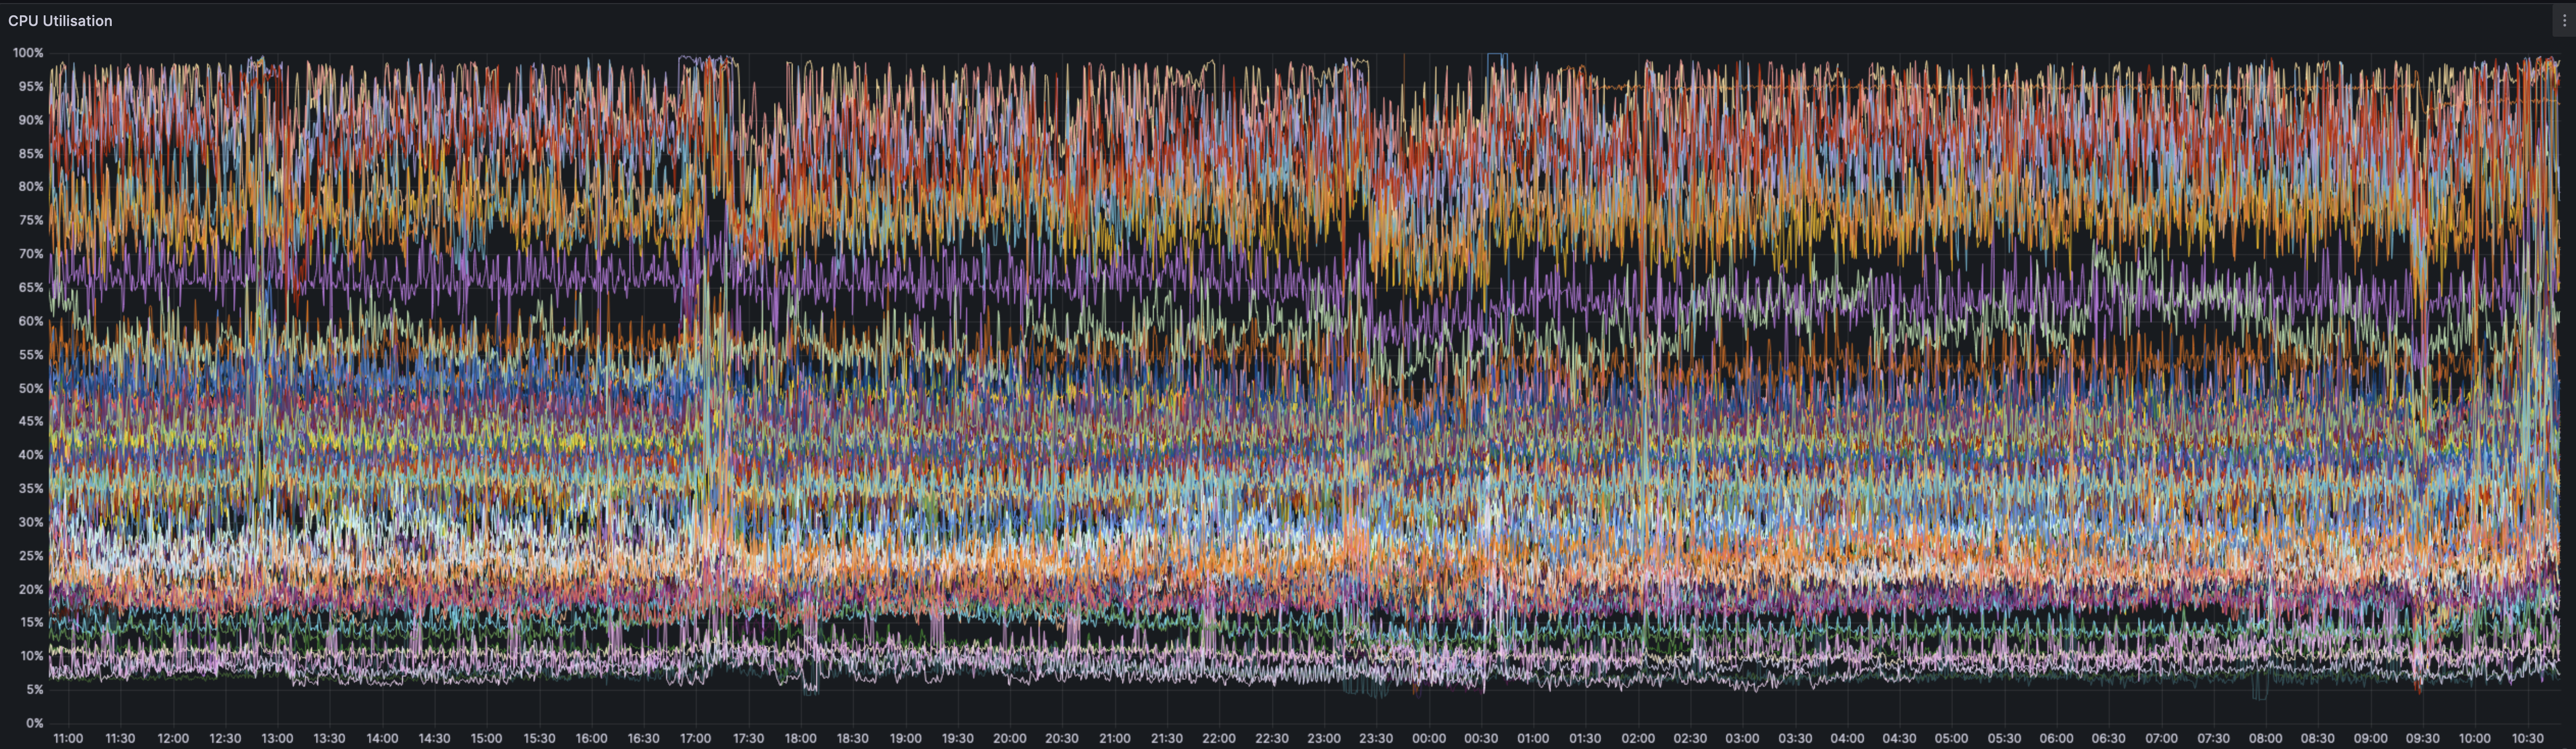
We see no measable change in CPU usage from pre-post spam tests. The CPU usage stays within margin of error and contains some more spikes, which is likely related to the handling of invalid blobber blobs.
Based on a request from client teams, we have a new dashboard that splits the resource usage by EL/CL and then can be further filtered by clients themselves. So one can exactly filter and find the resource use of purely lighthouse or lighthouse across all the ELs.
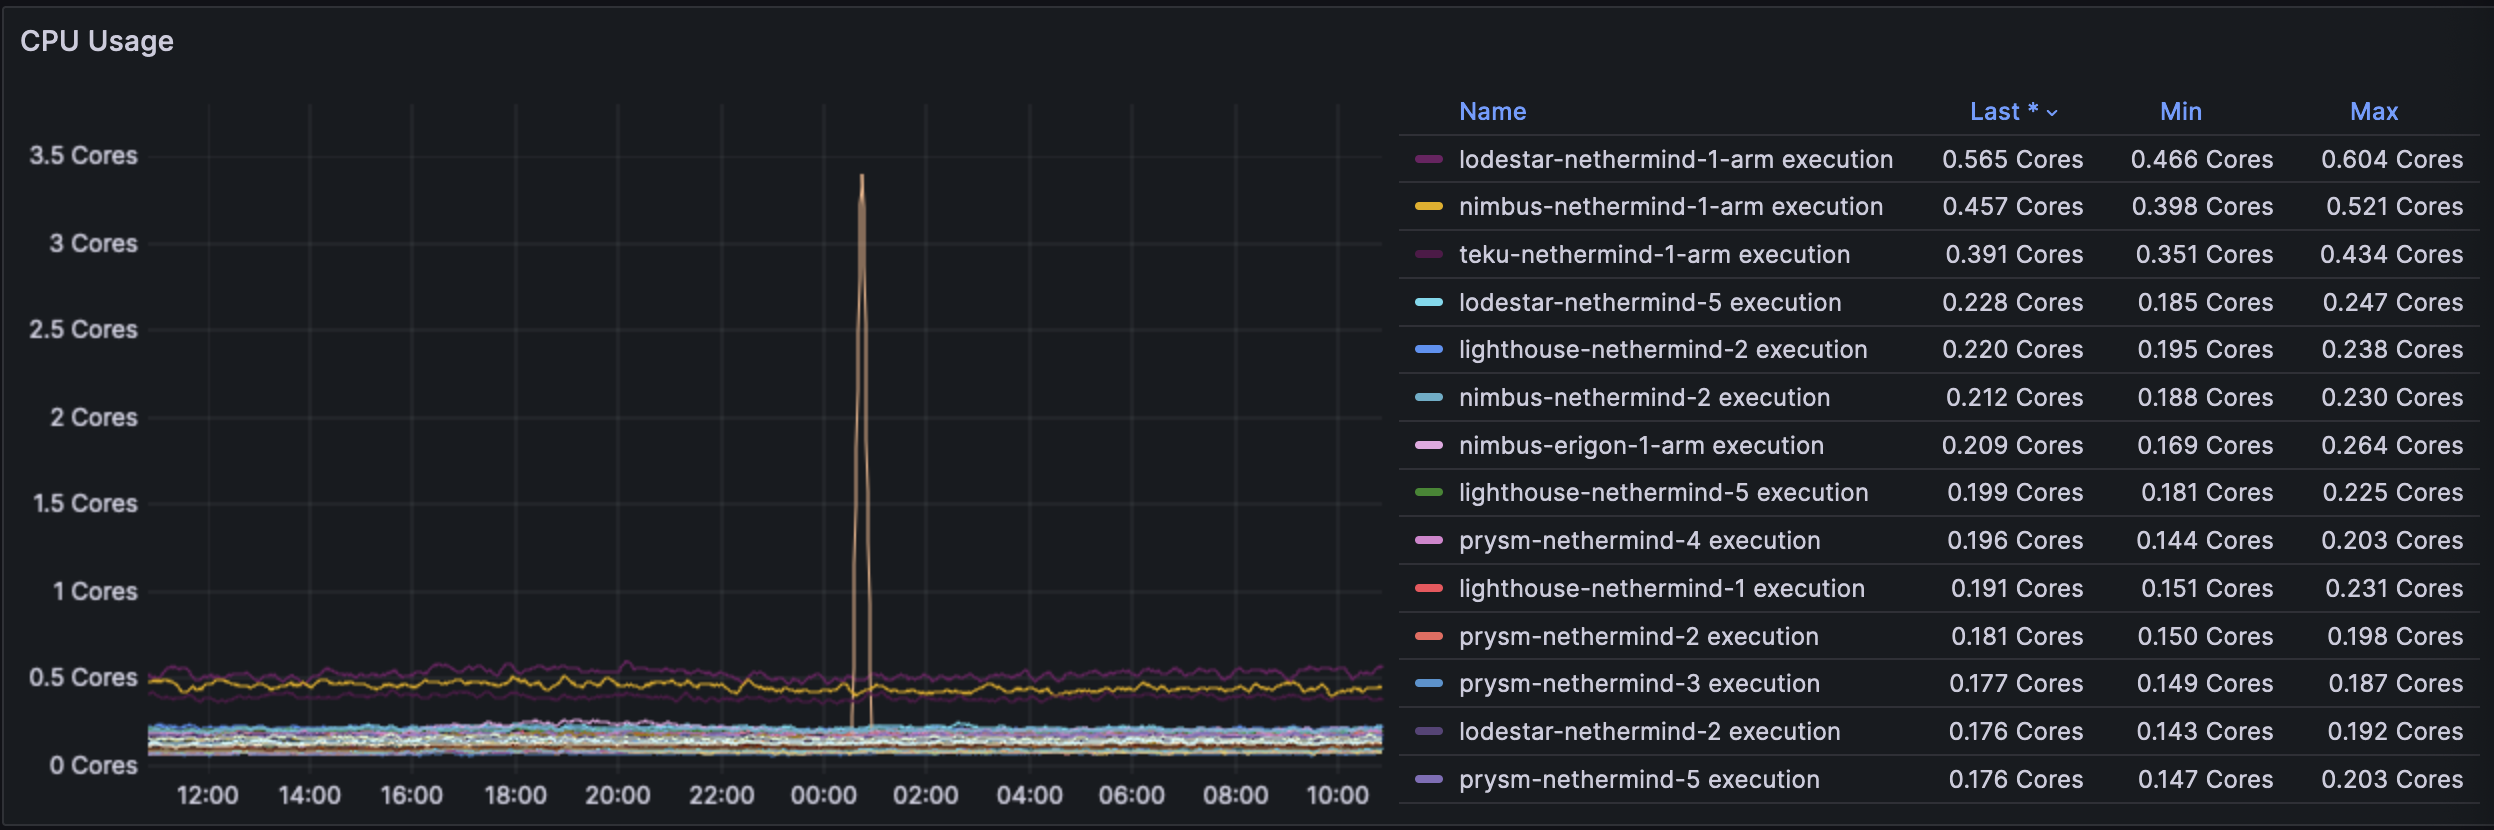
The EL usage did not change in any way and is largely stable. Since the earlier blob spamming was at a level of 1->4 and the new rate is 6+, it seems that the ELs are able to gossip the excess without a change in resource use. The singular spike is a nimbus-besu node and perhaps the spike is due to reorgs caused by the invalid blobs sent by the blobber.
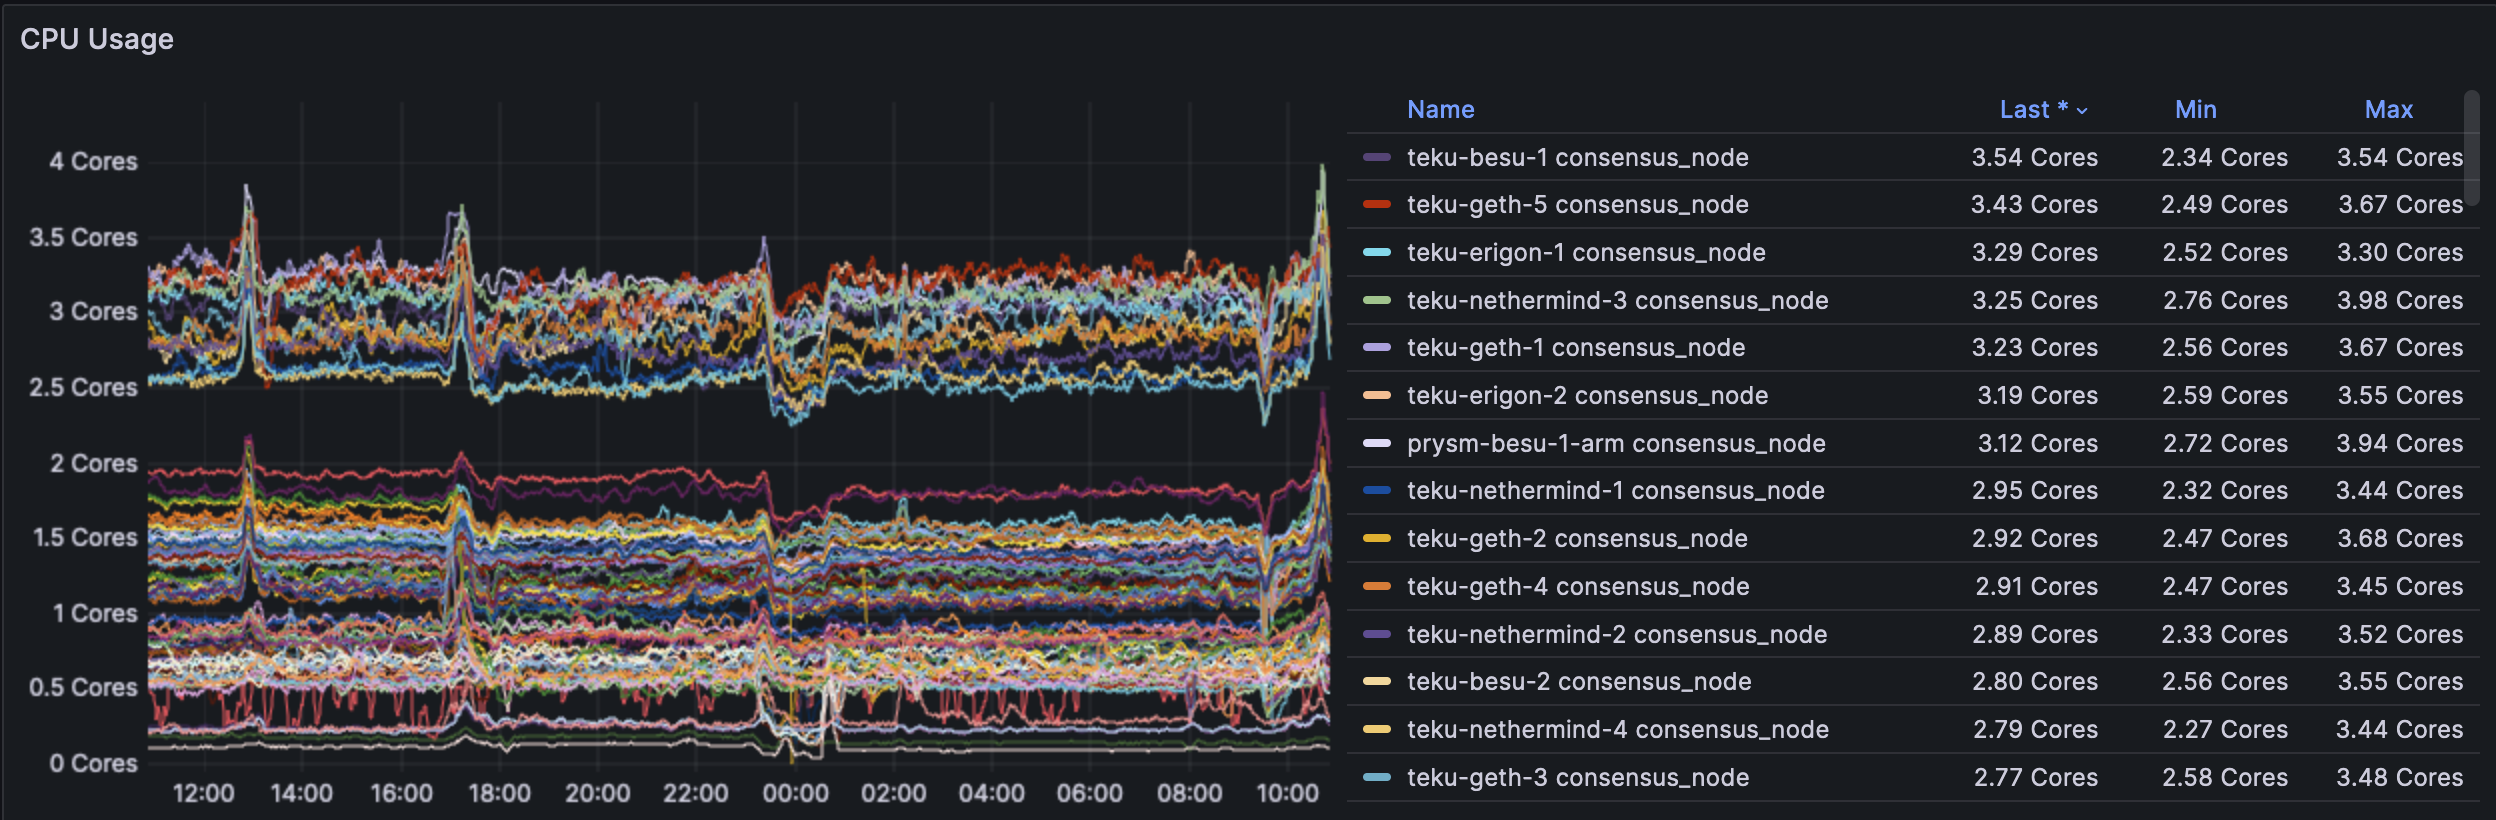
The CL side sees no change in CPU usage and it appears that the excess blobs play no real role when seen across all clients.
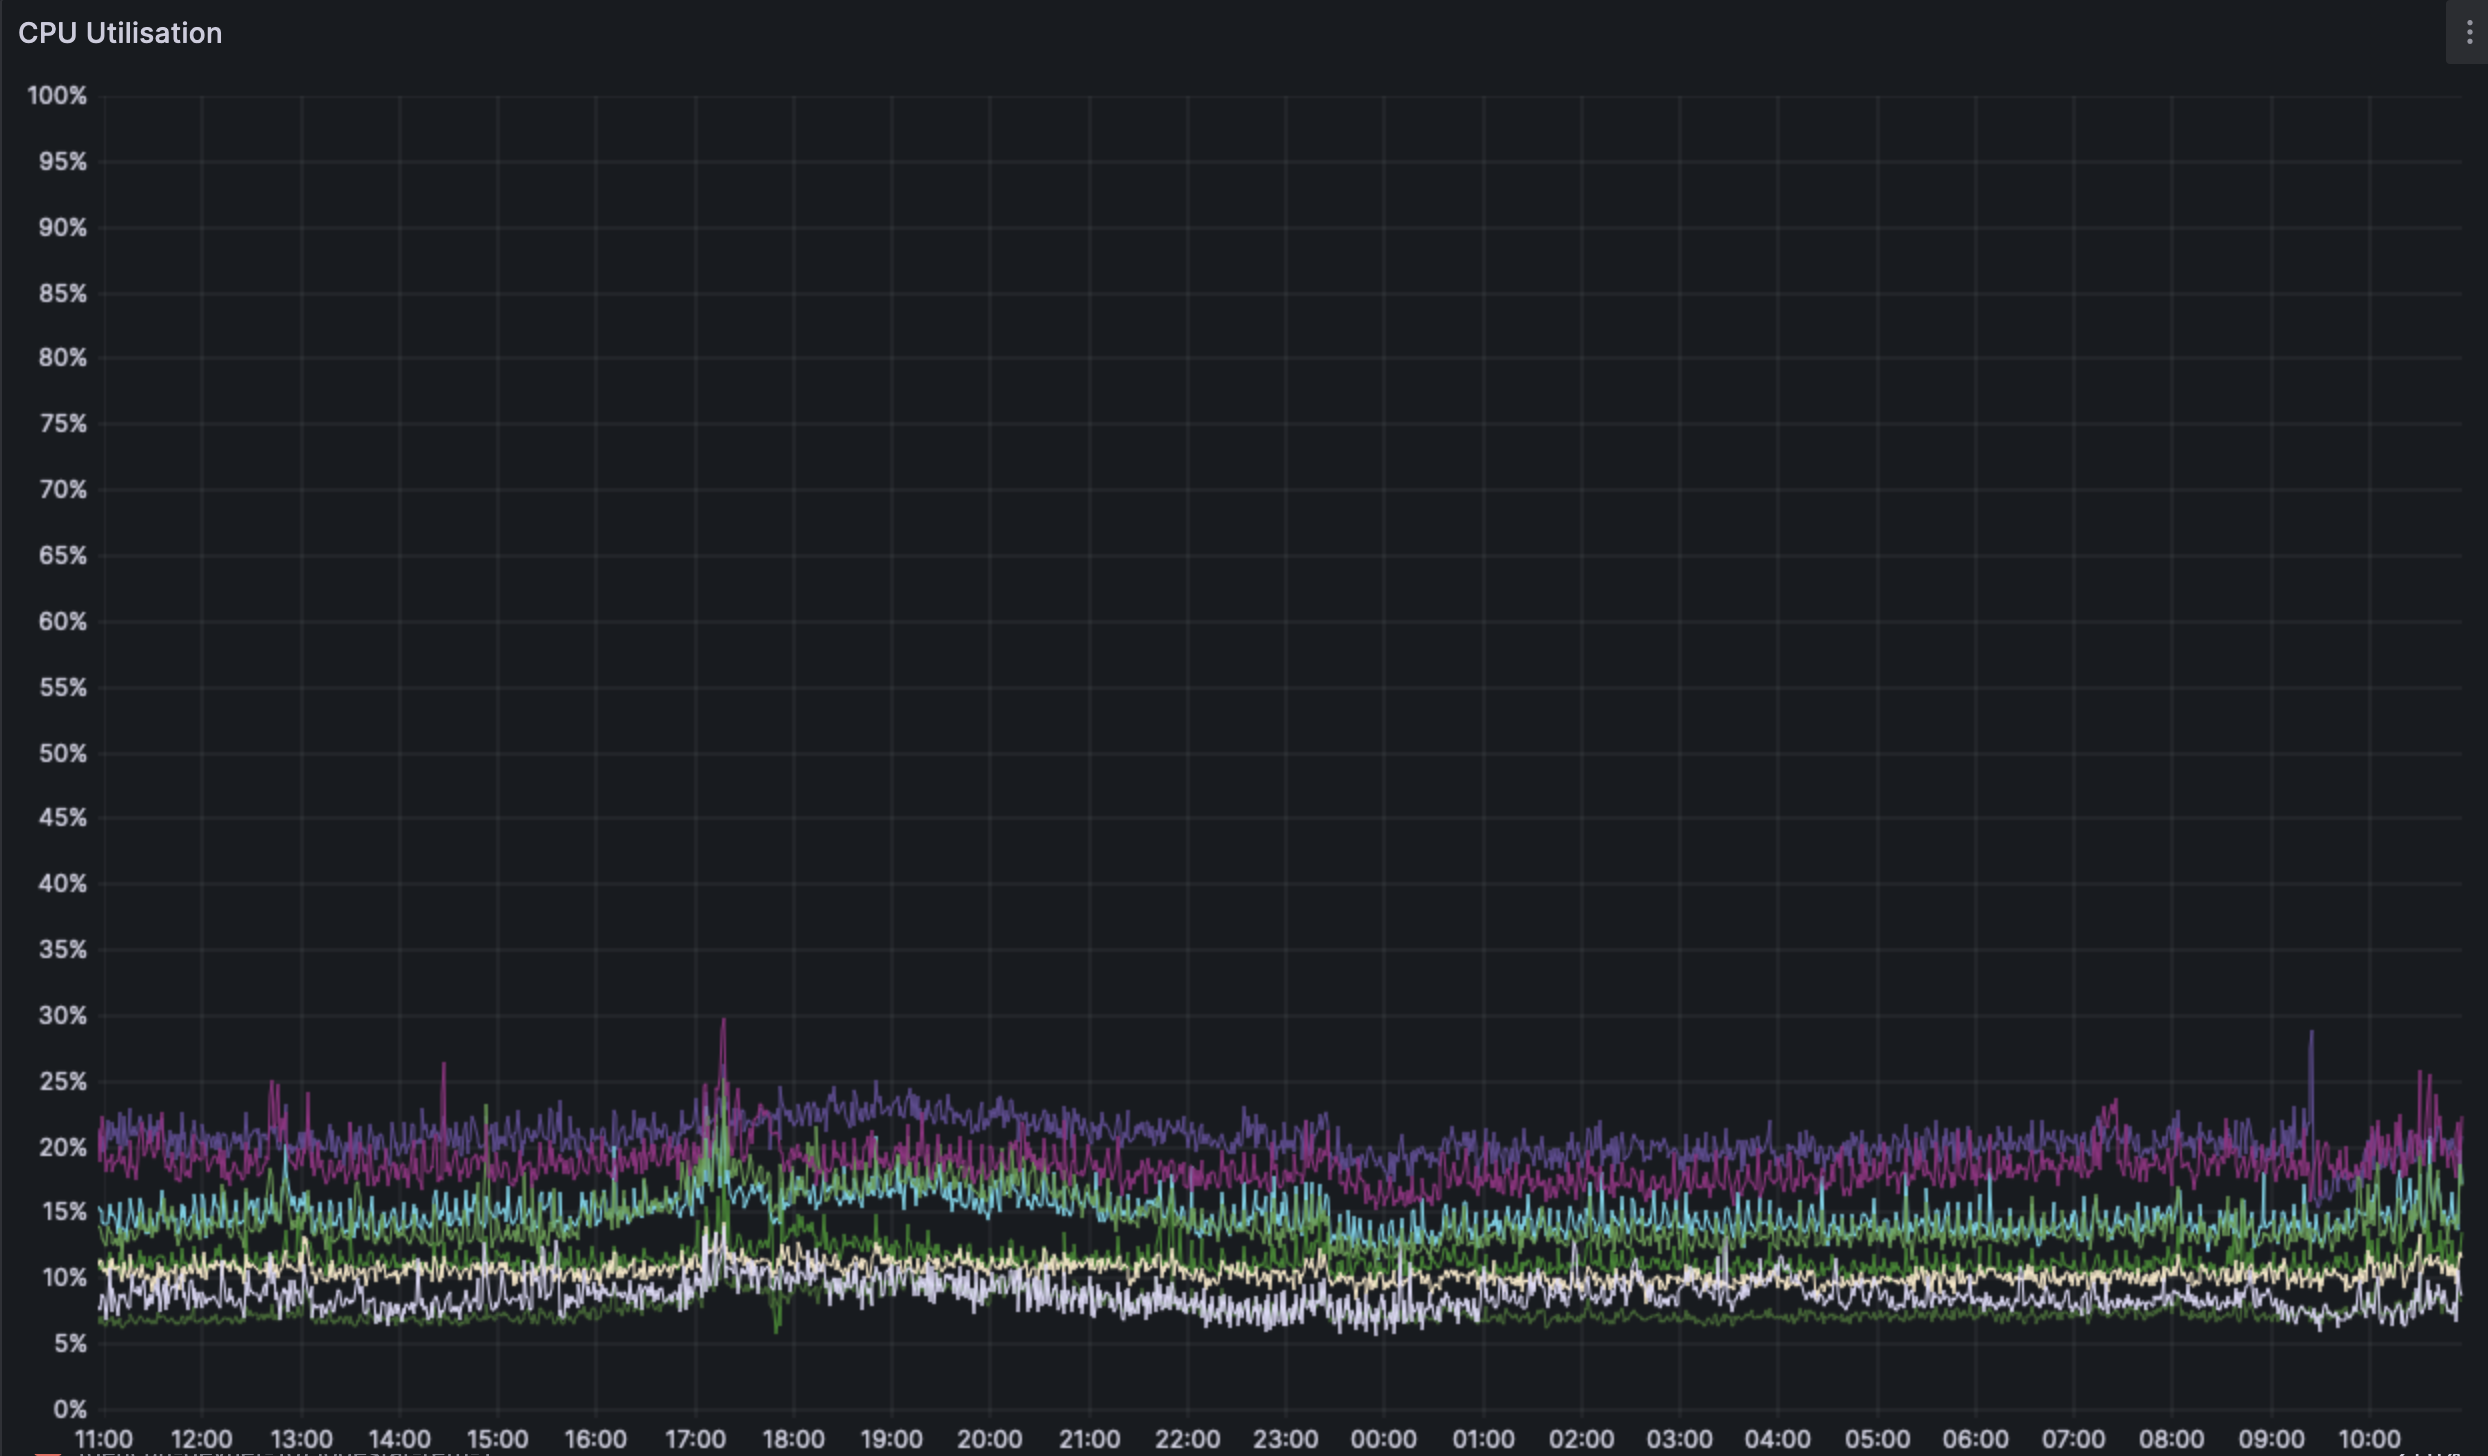
ARM machines see no perceivable change in their resource use.
### Overall RAM:
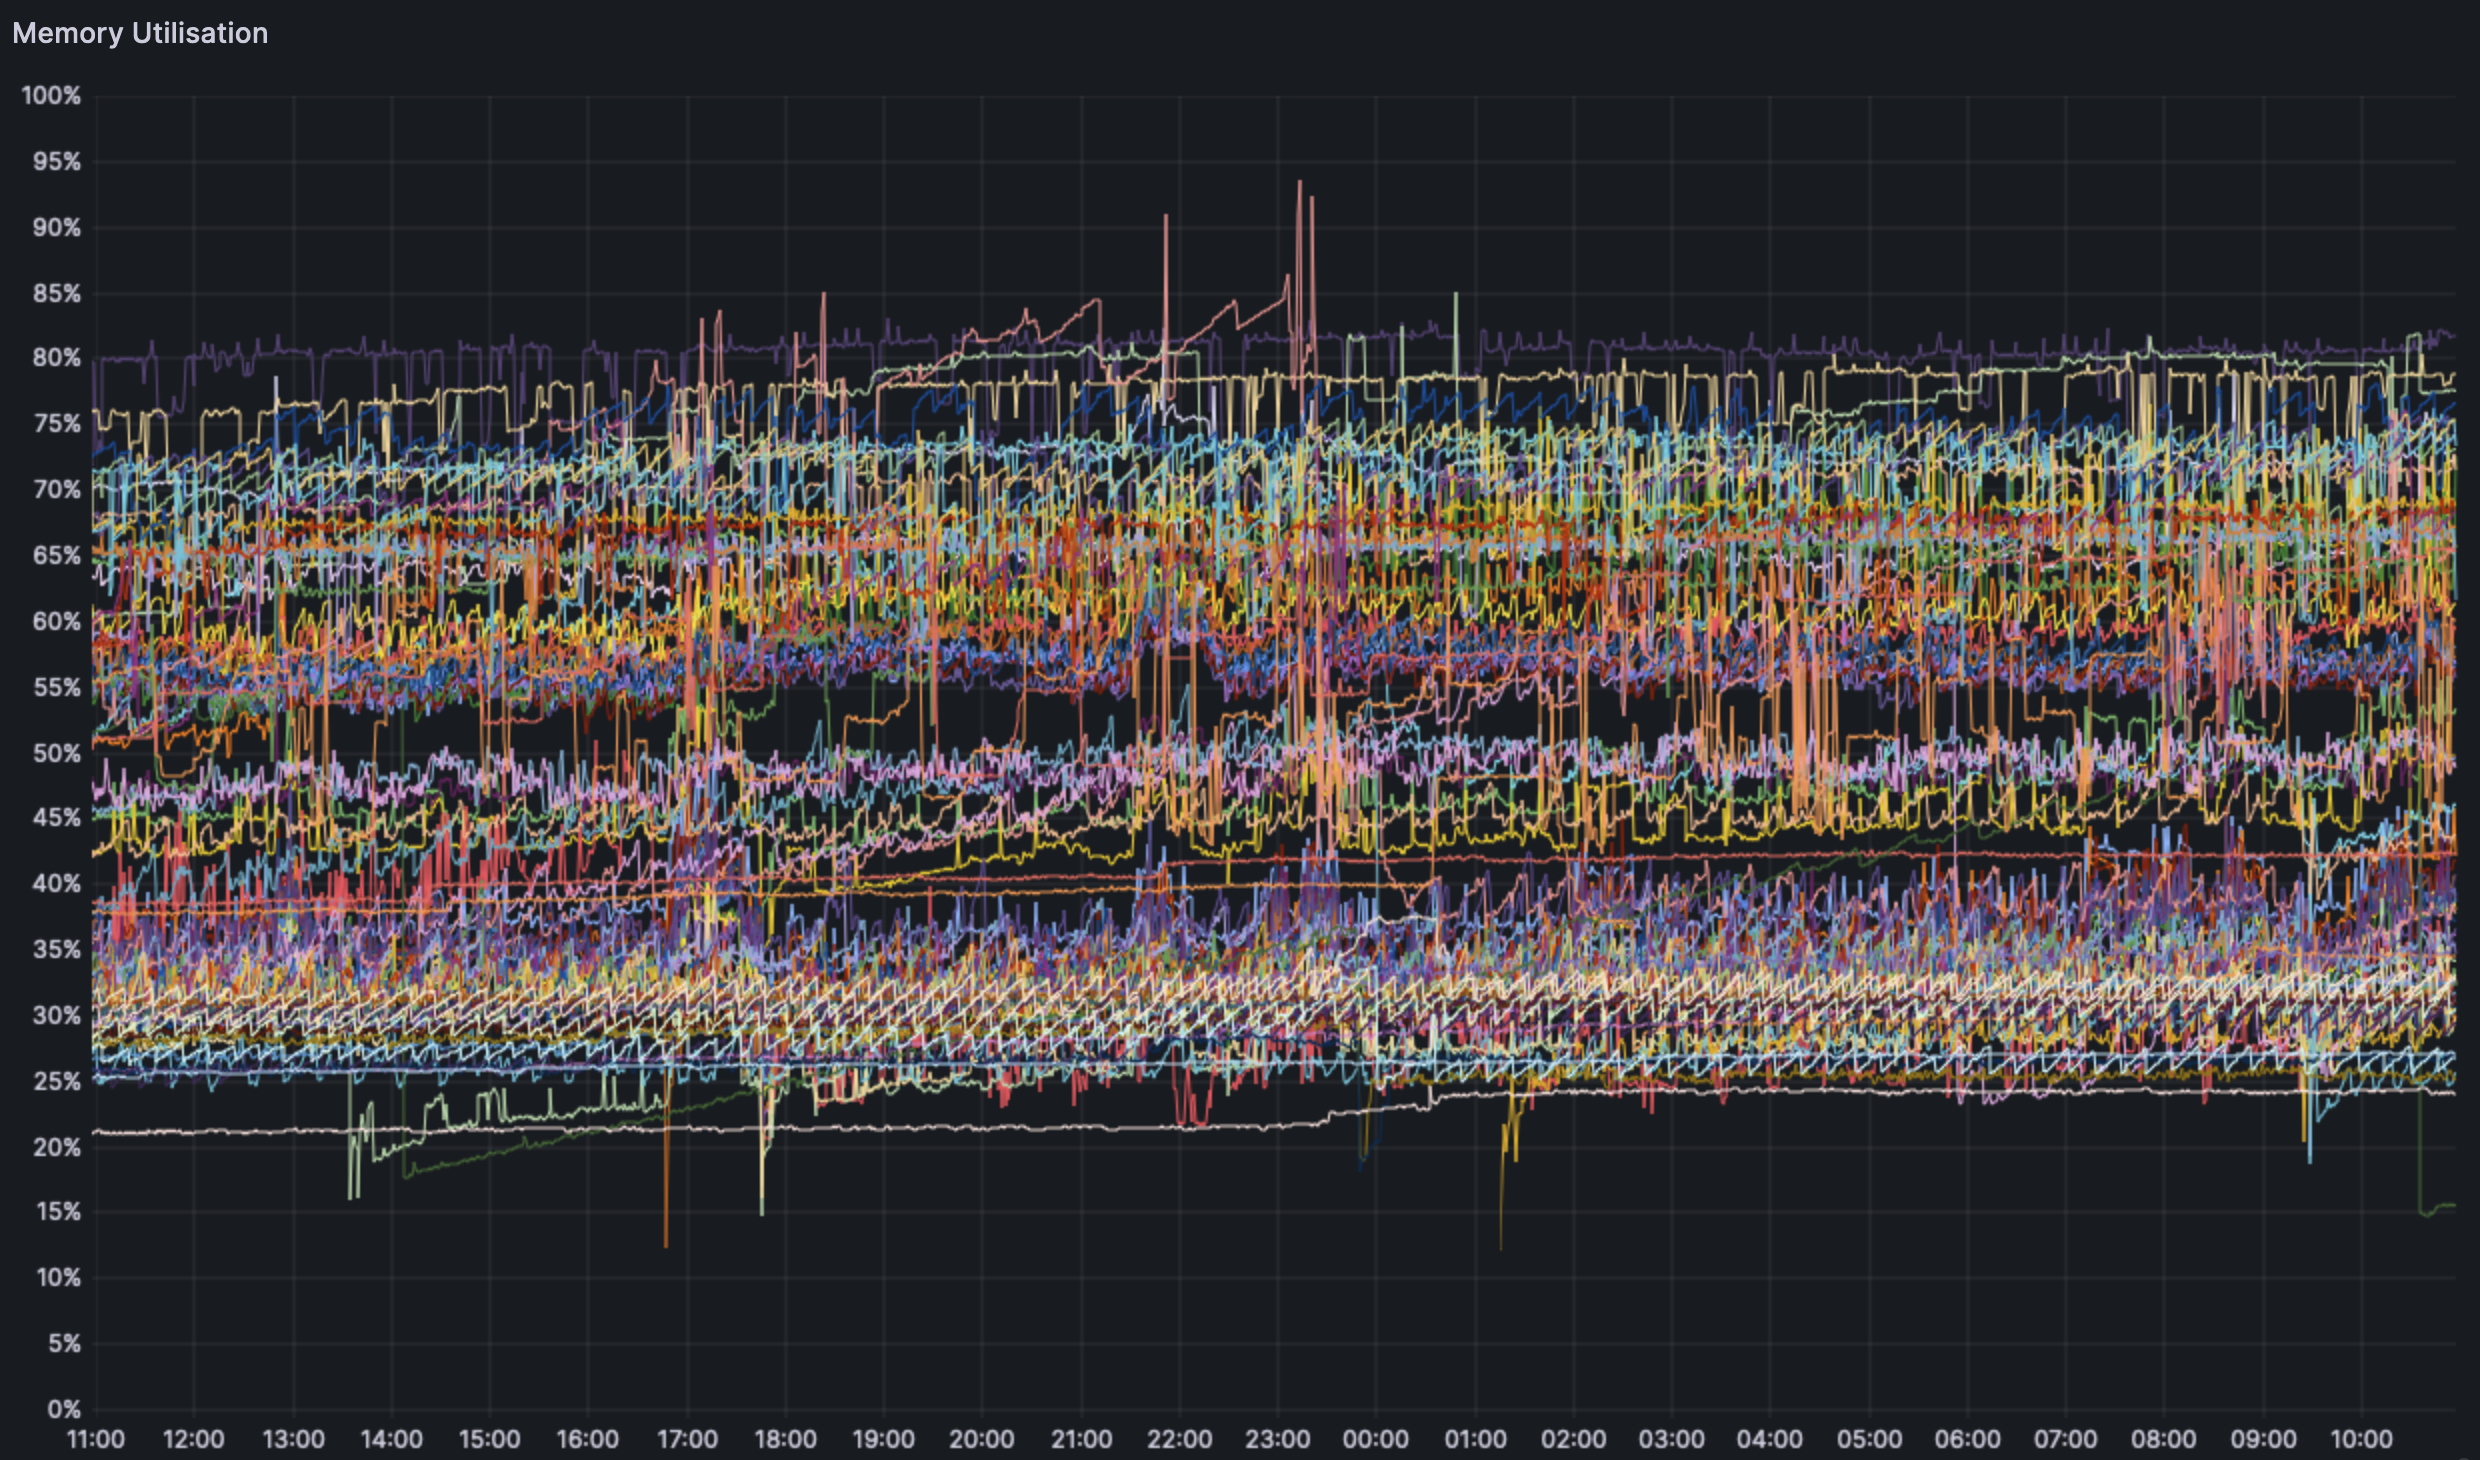
Overall RAM use seems to show no clear trend across the board. This could be related to just too much data and a bad visualization.
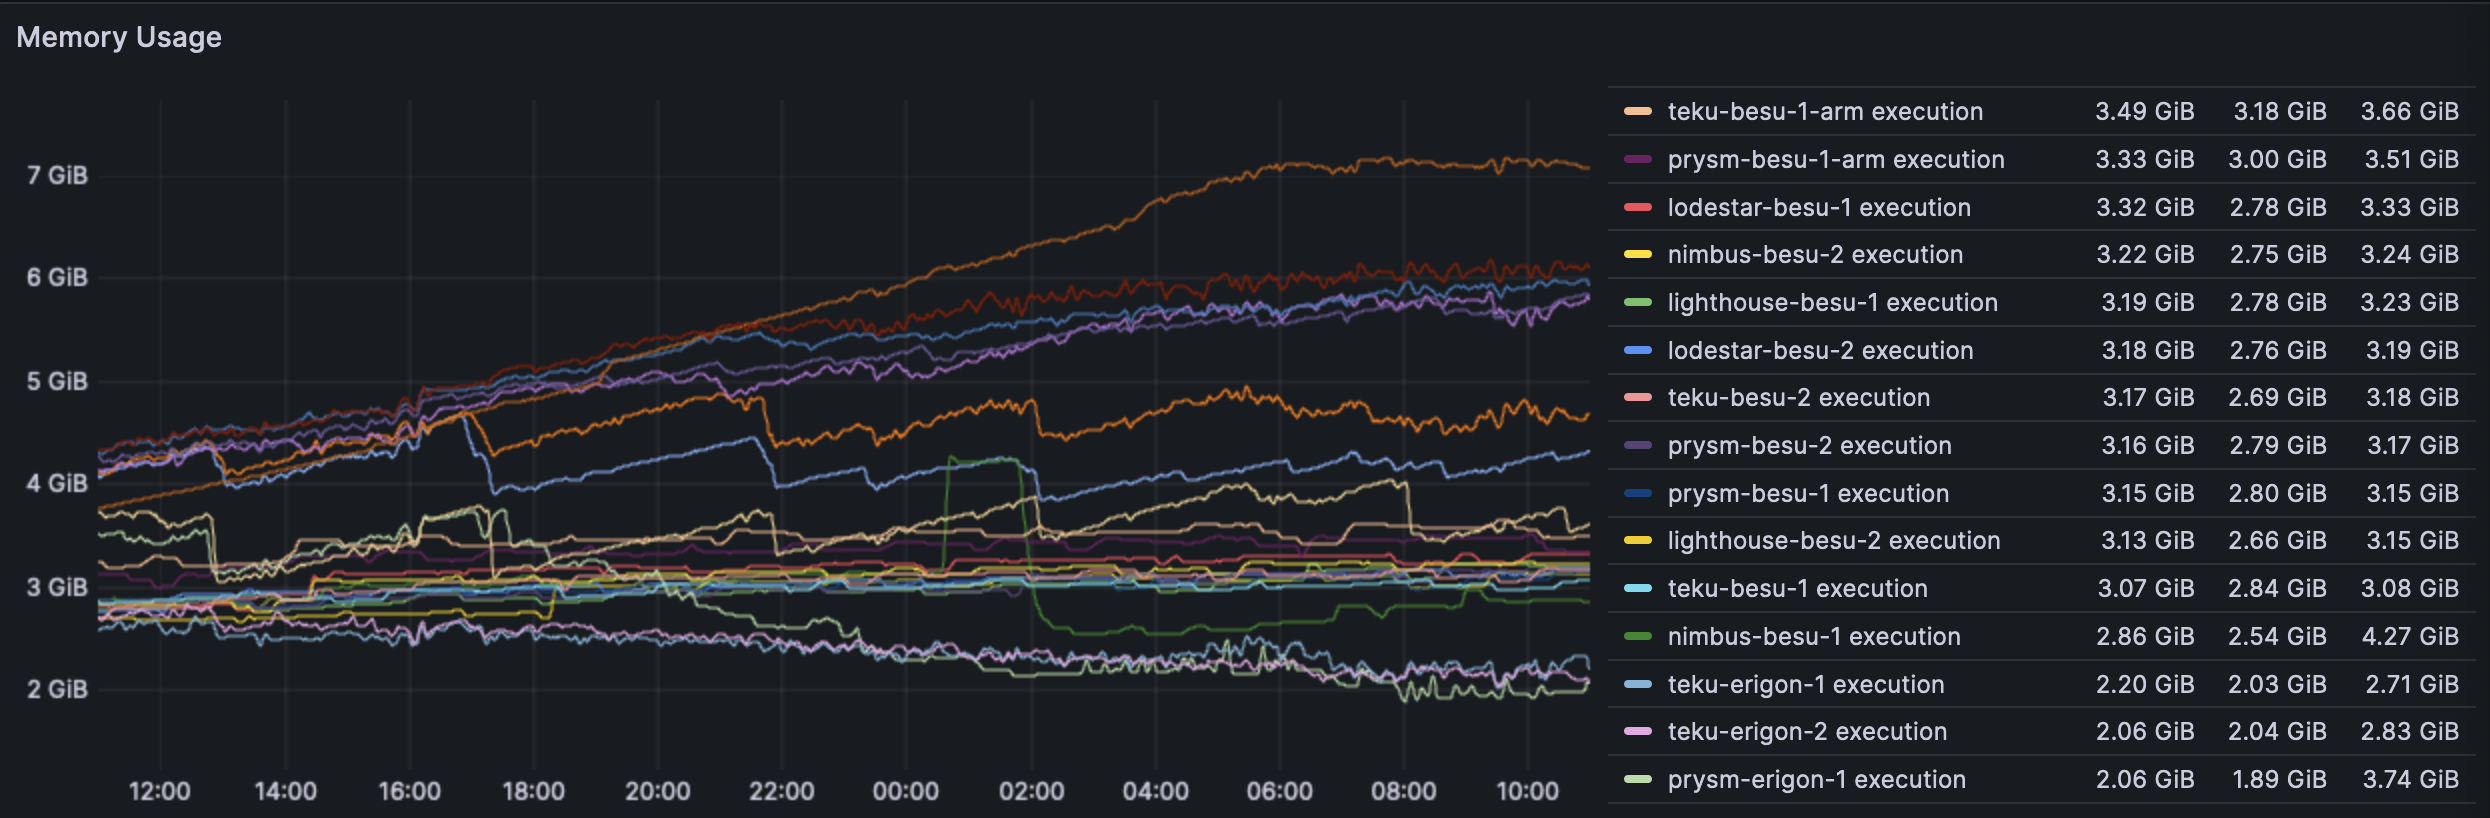
EL RAM usage seems to trend upwards for certain clients. This would make sense as there is more blob gossip in the network.
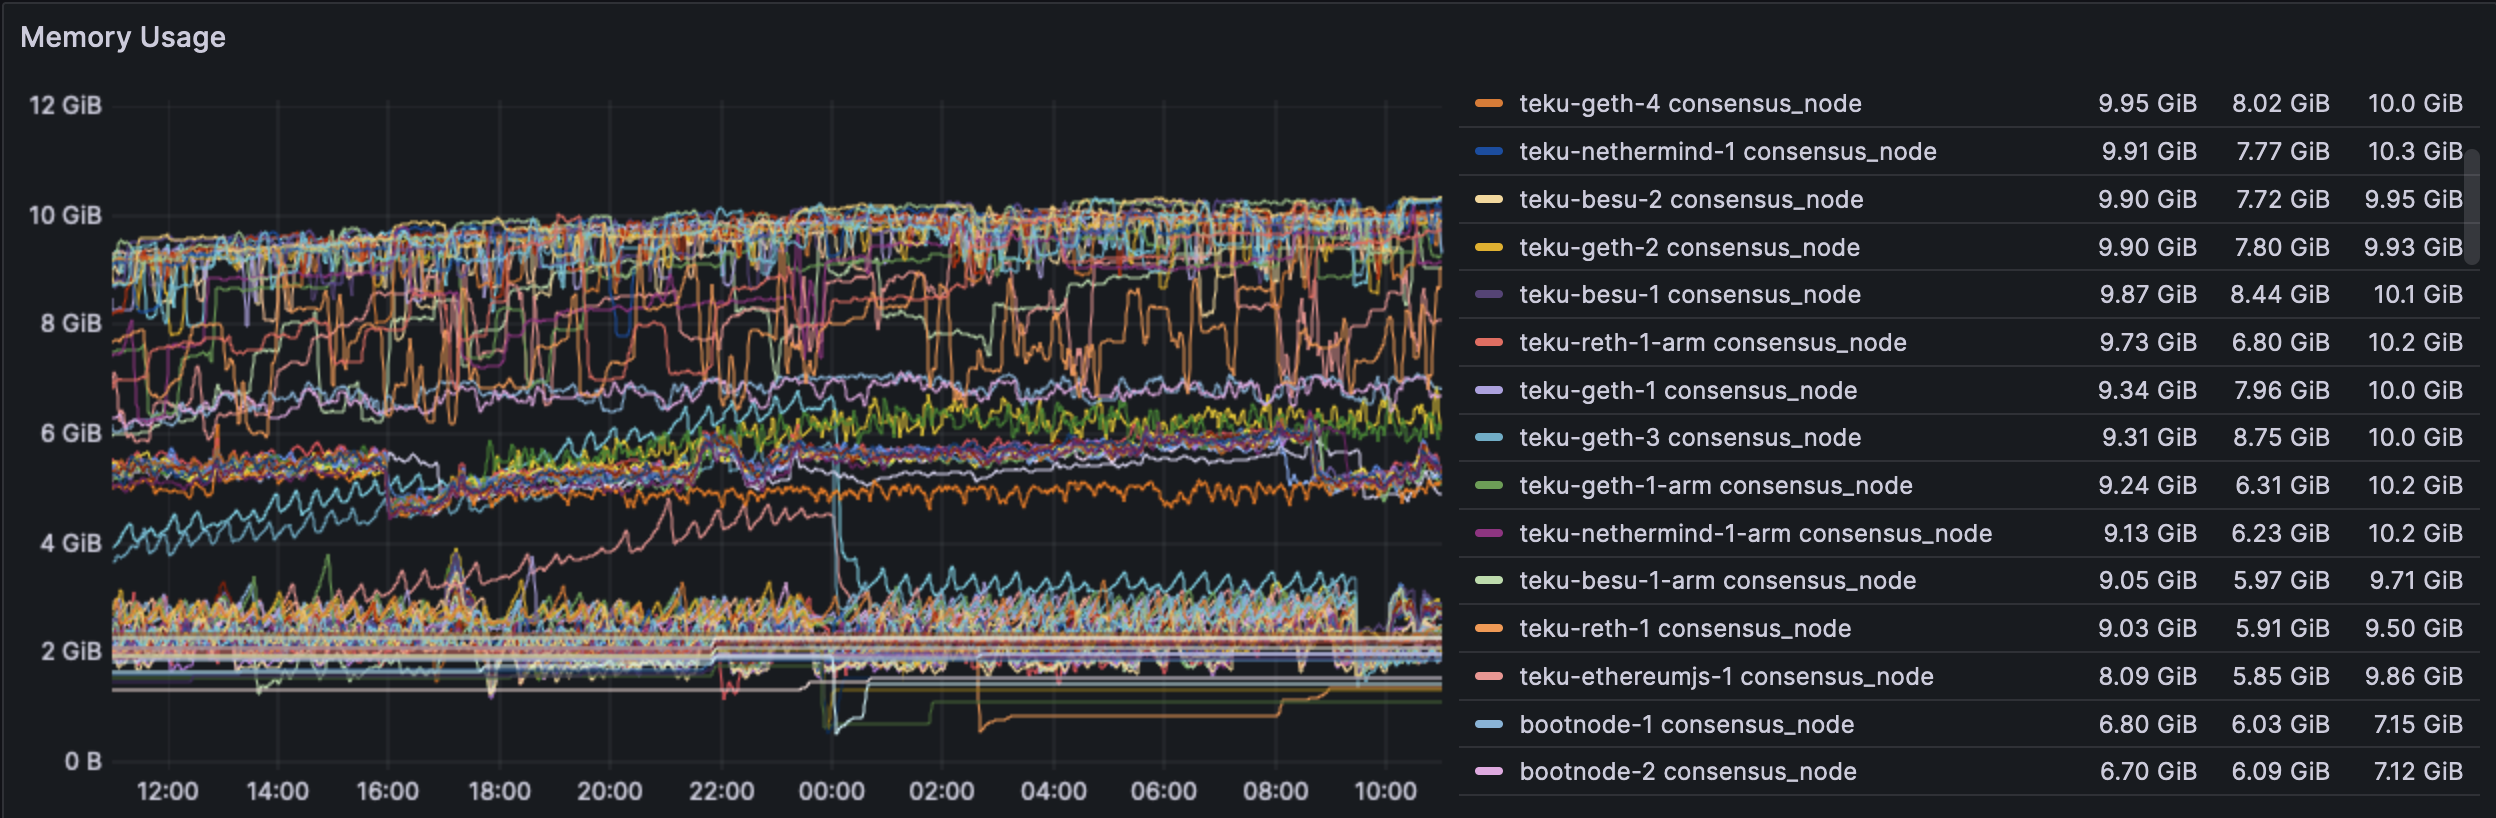
CL RAM usage seems mostly stable. Some clients do indeed increase in RAM use before dropping down again. This behaviour is yet unexplained.
### Geth/Erigon network use:
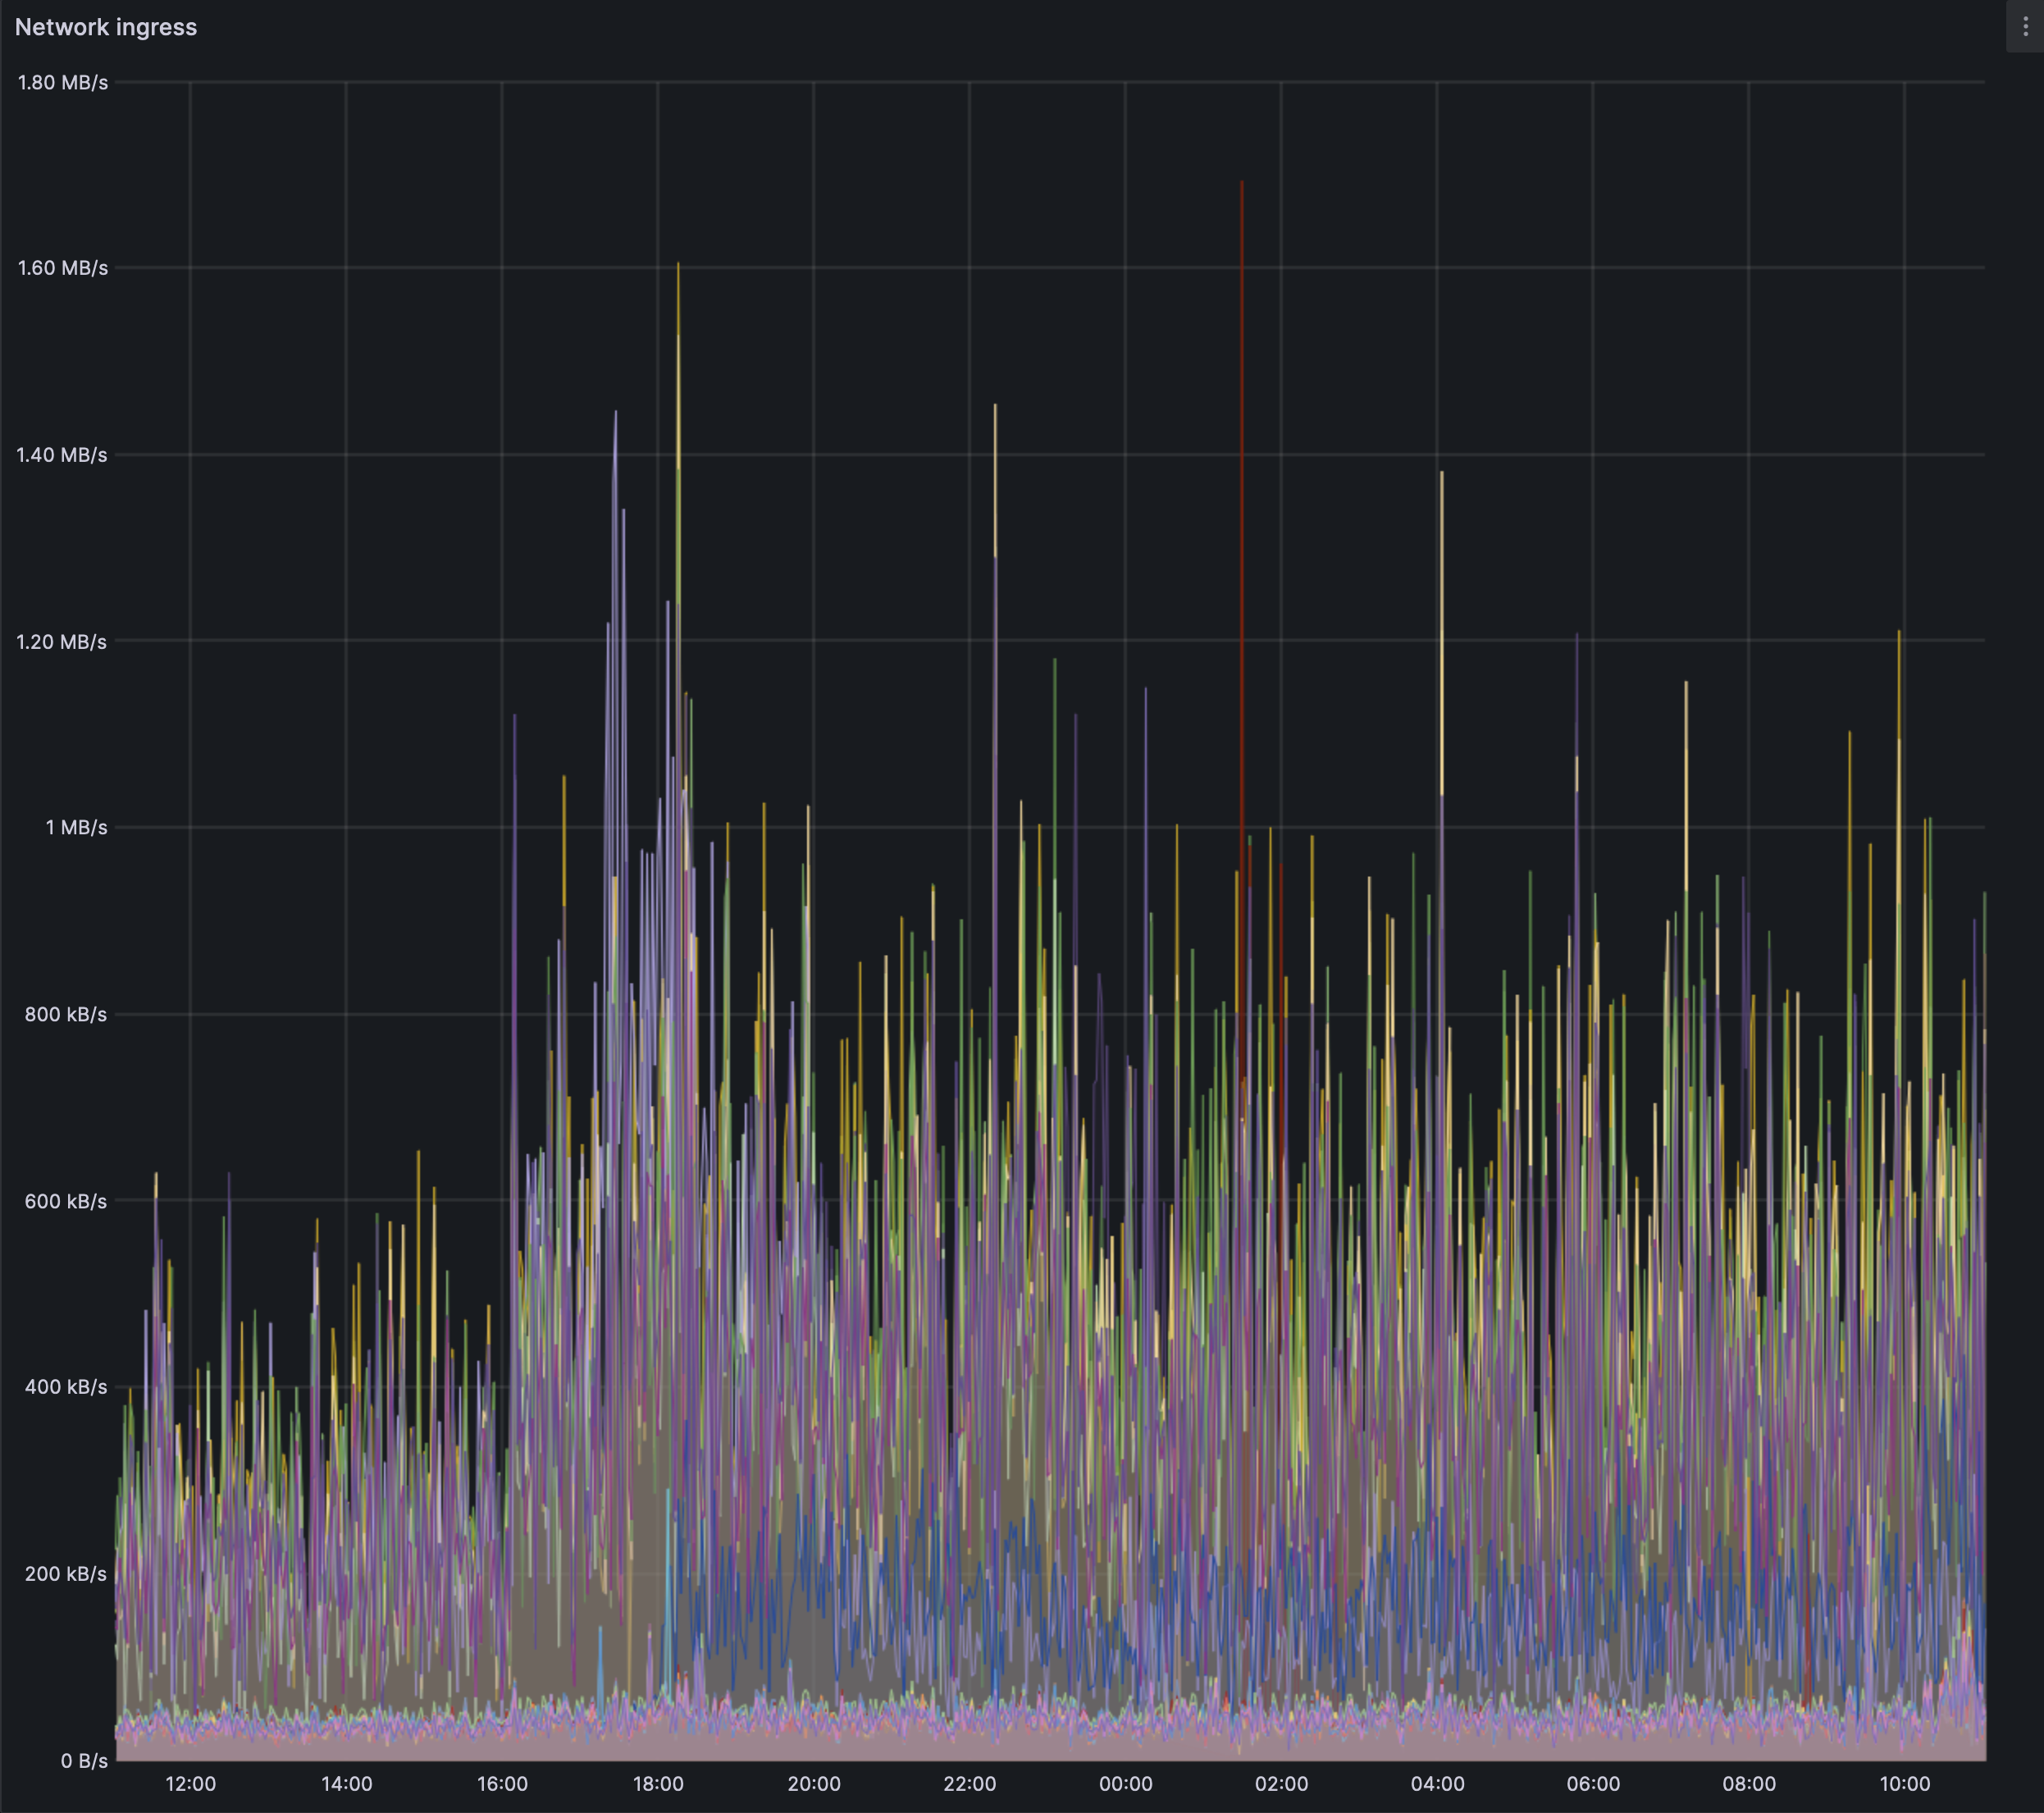
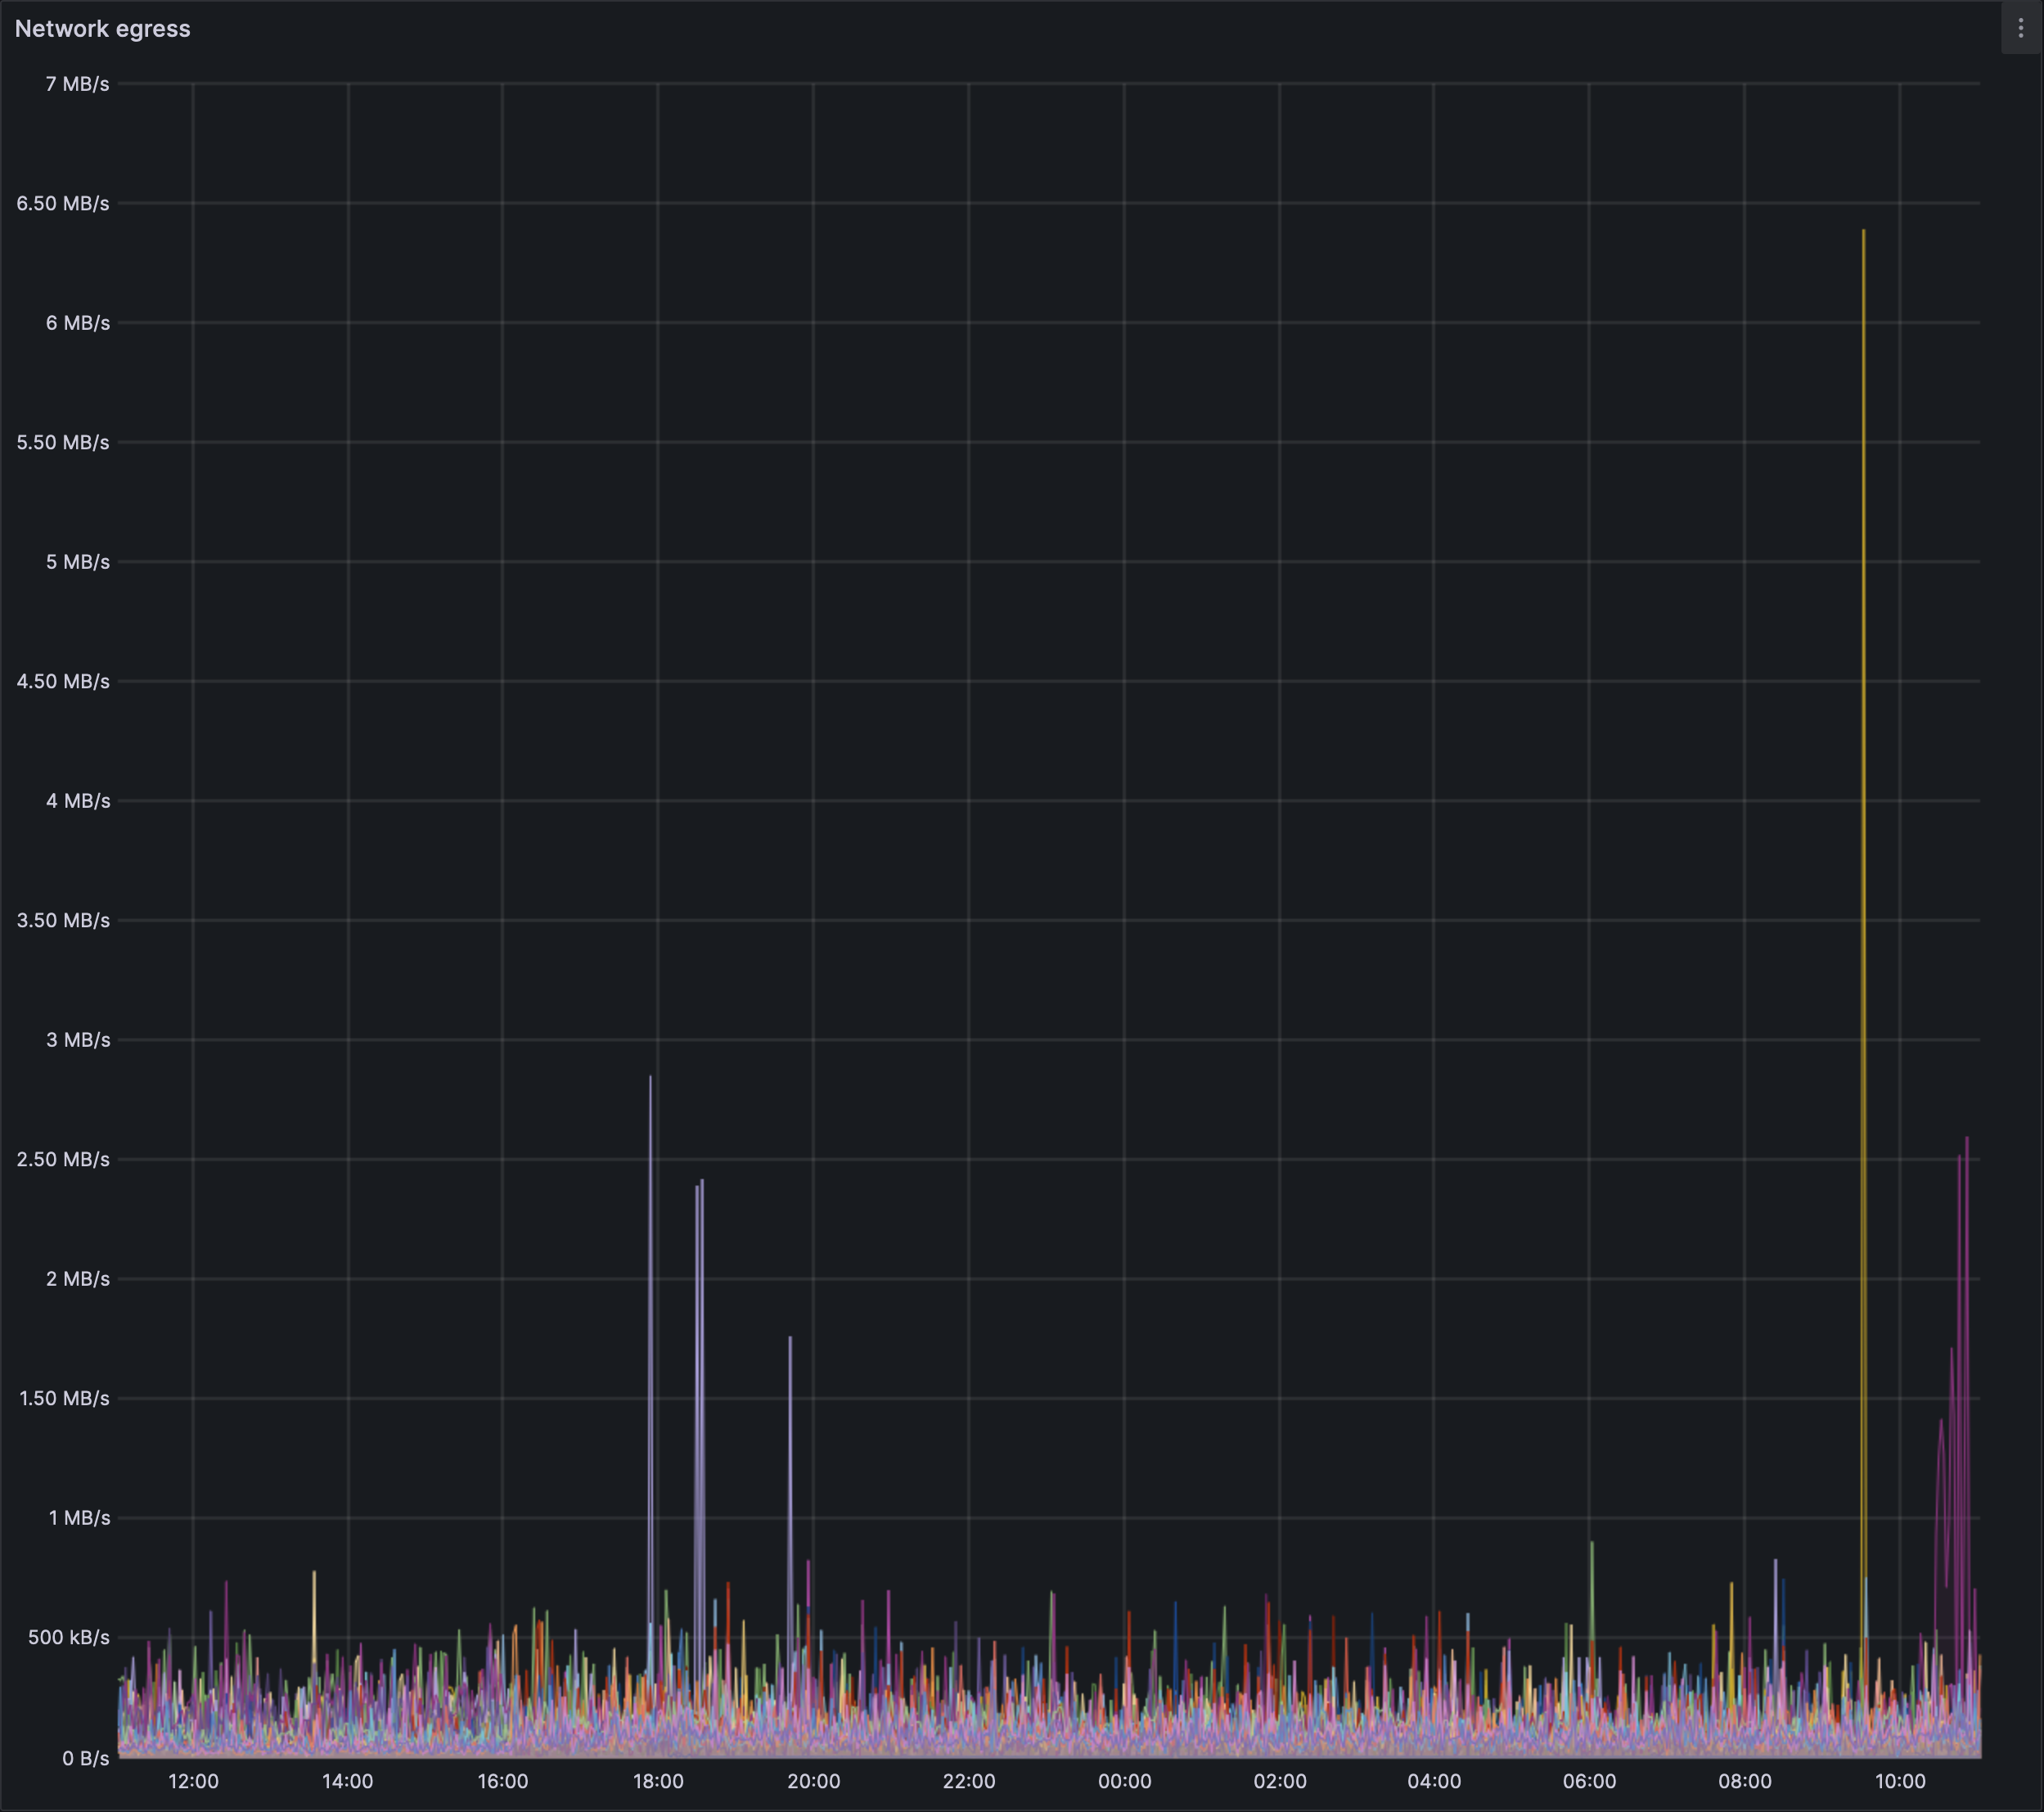
We can see the network use trend upwards for the EL after blob spamming has started. The ingress spikes seem to top out at 1.6 MB/s. The egress spikes seem lower, the bursts of up to 6.5 MB/s is as yet unexplained and isn't co-related to any big change so far.
## Network health
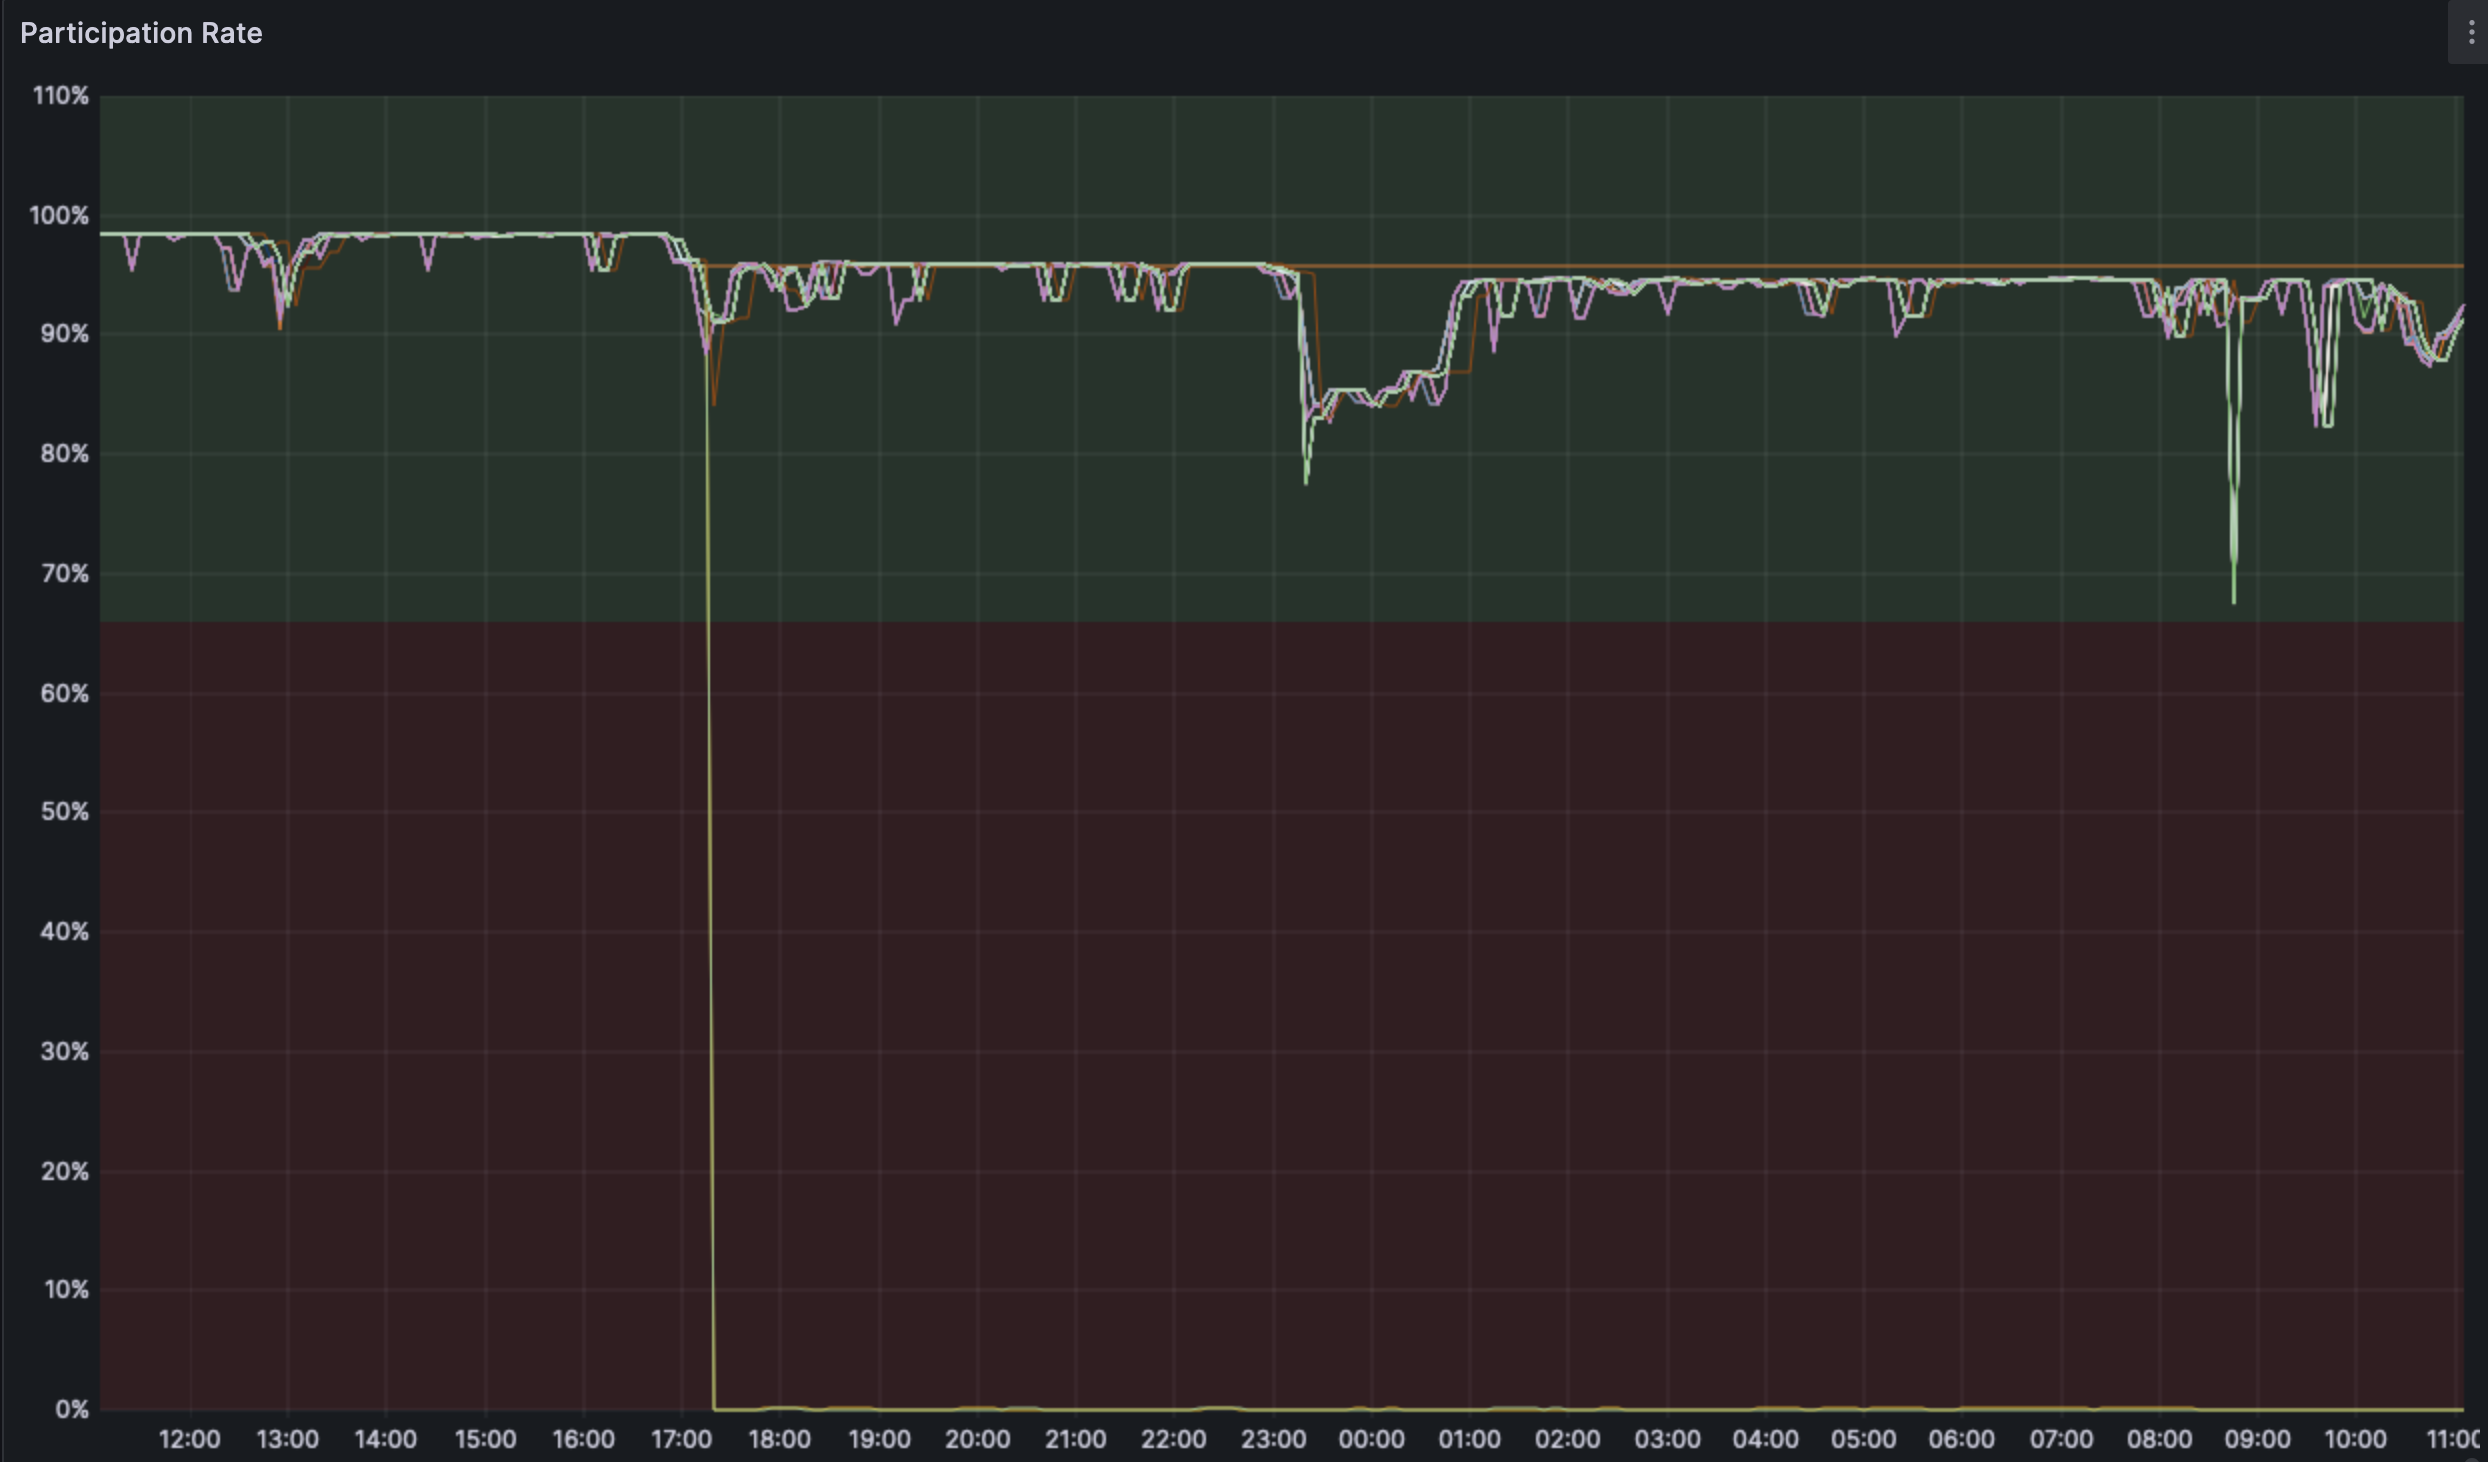
The participation rate has indeed dropped down. This is related directly to teh blobber being started and some prysm/nimbus nodes being affected from it. The precipitous drop in participation rate is from a prysm node that could not recover to the canonical chain.
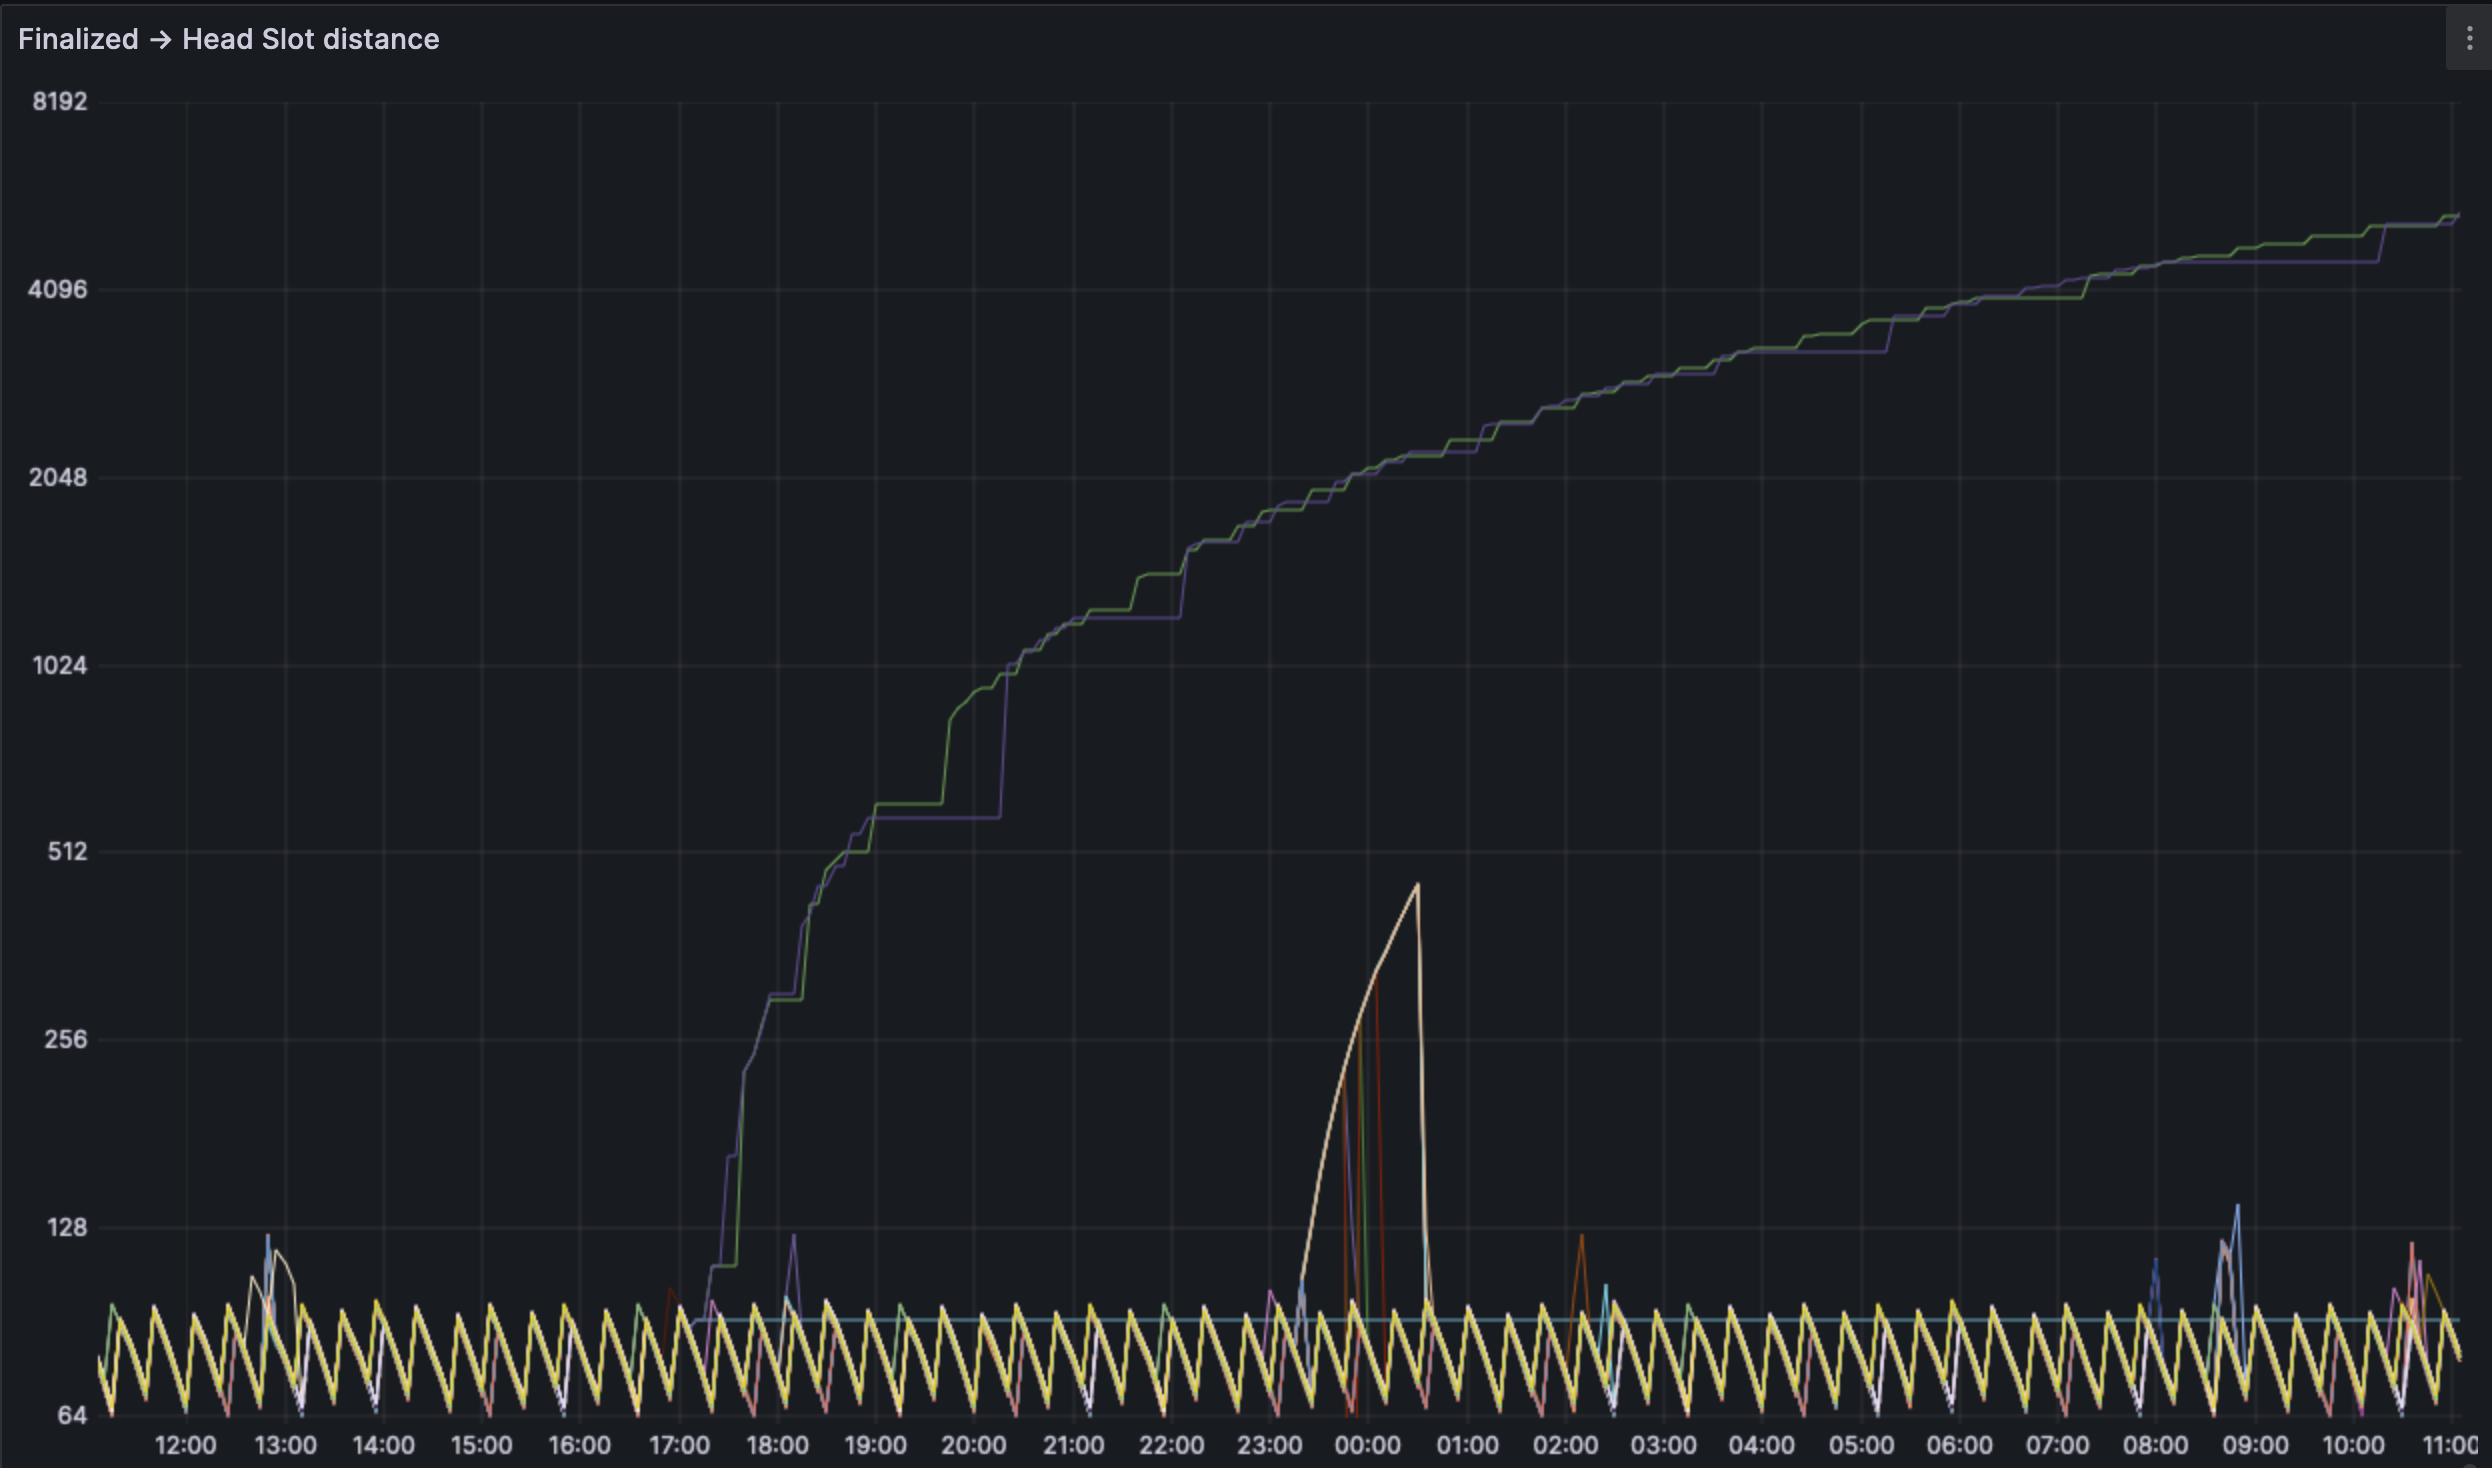
We still see a healthy, finalizing chain with some nodes as outliers. This is likely related to the blobber instead of any increase in blob use. The invalid blobs probably are locking up certain client pairs till they heal.
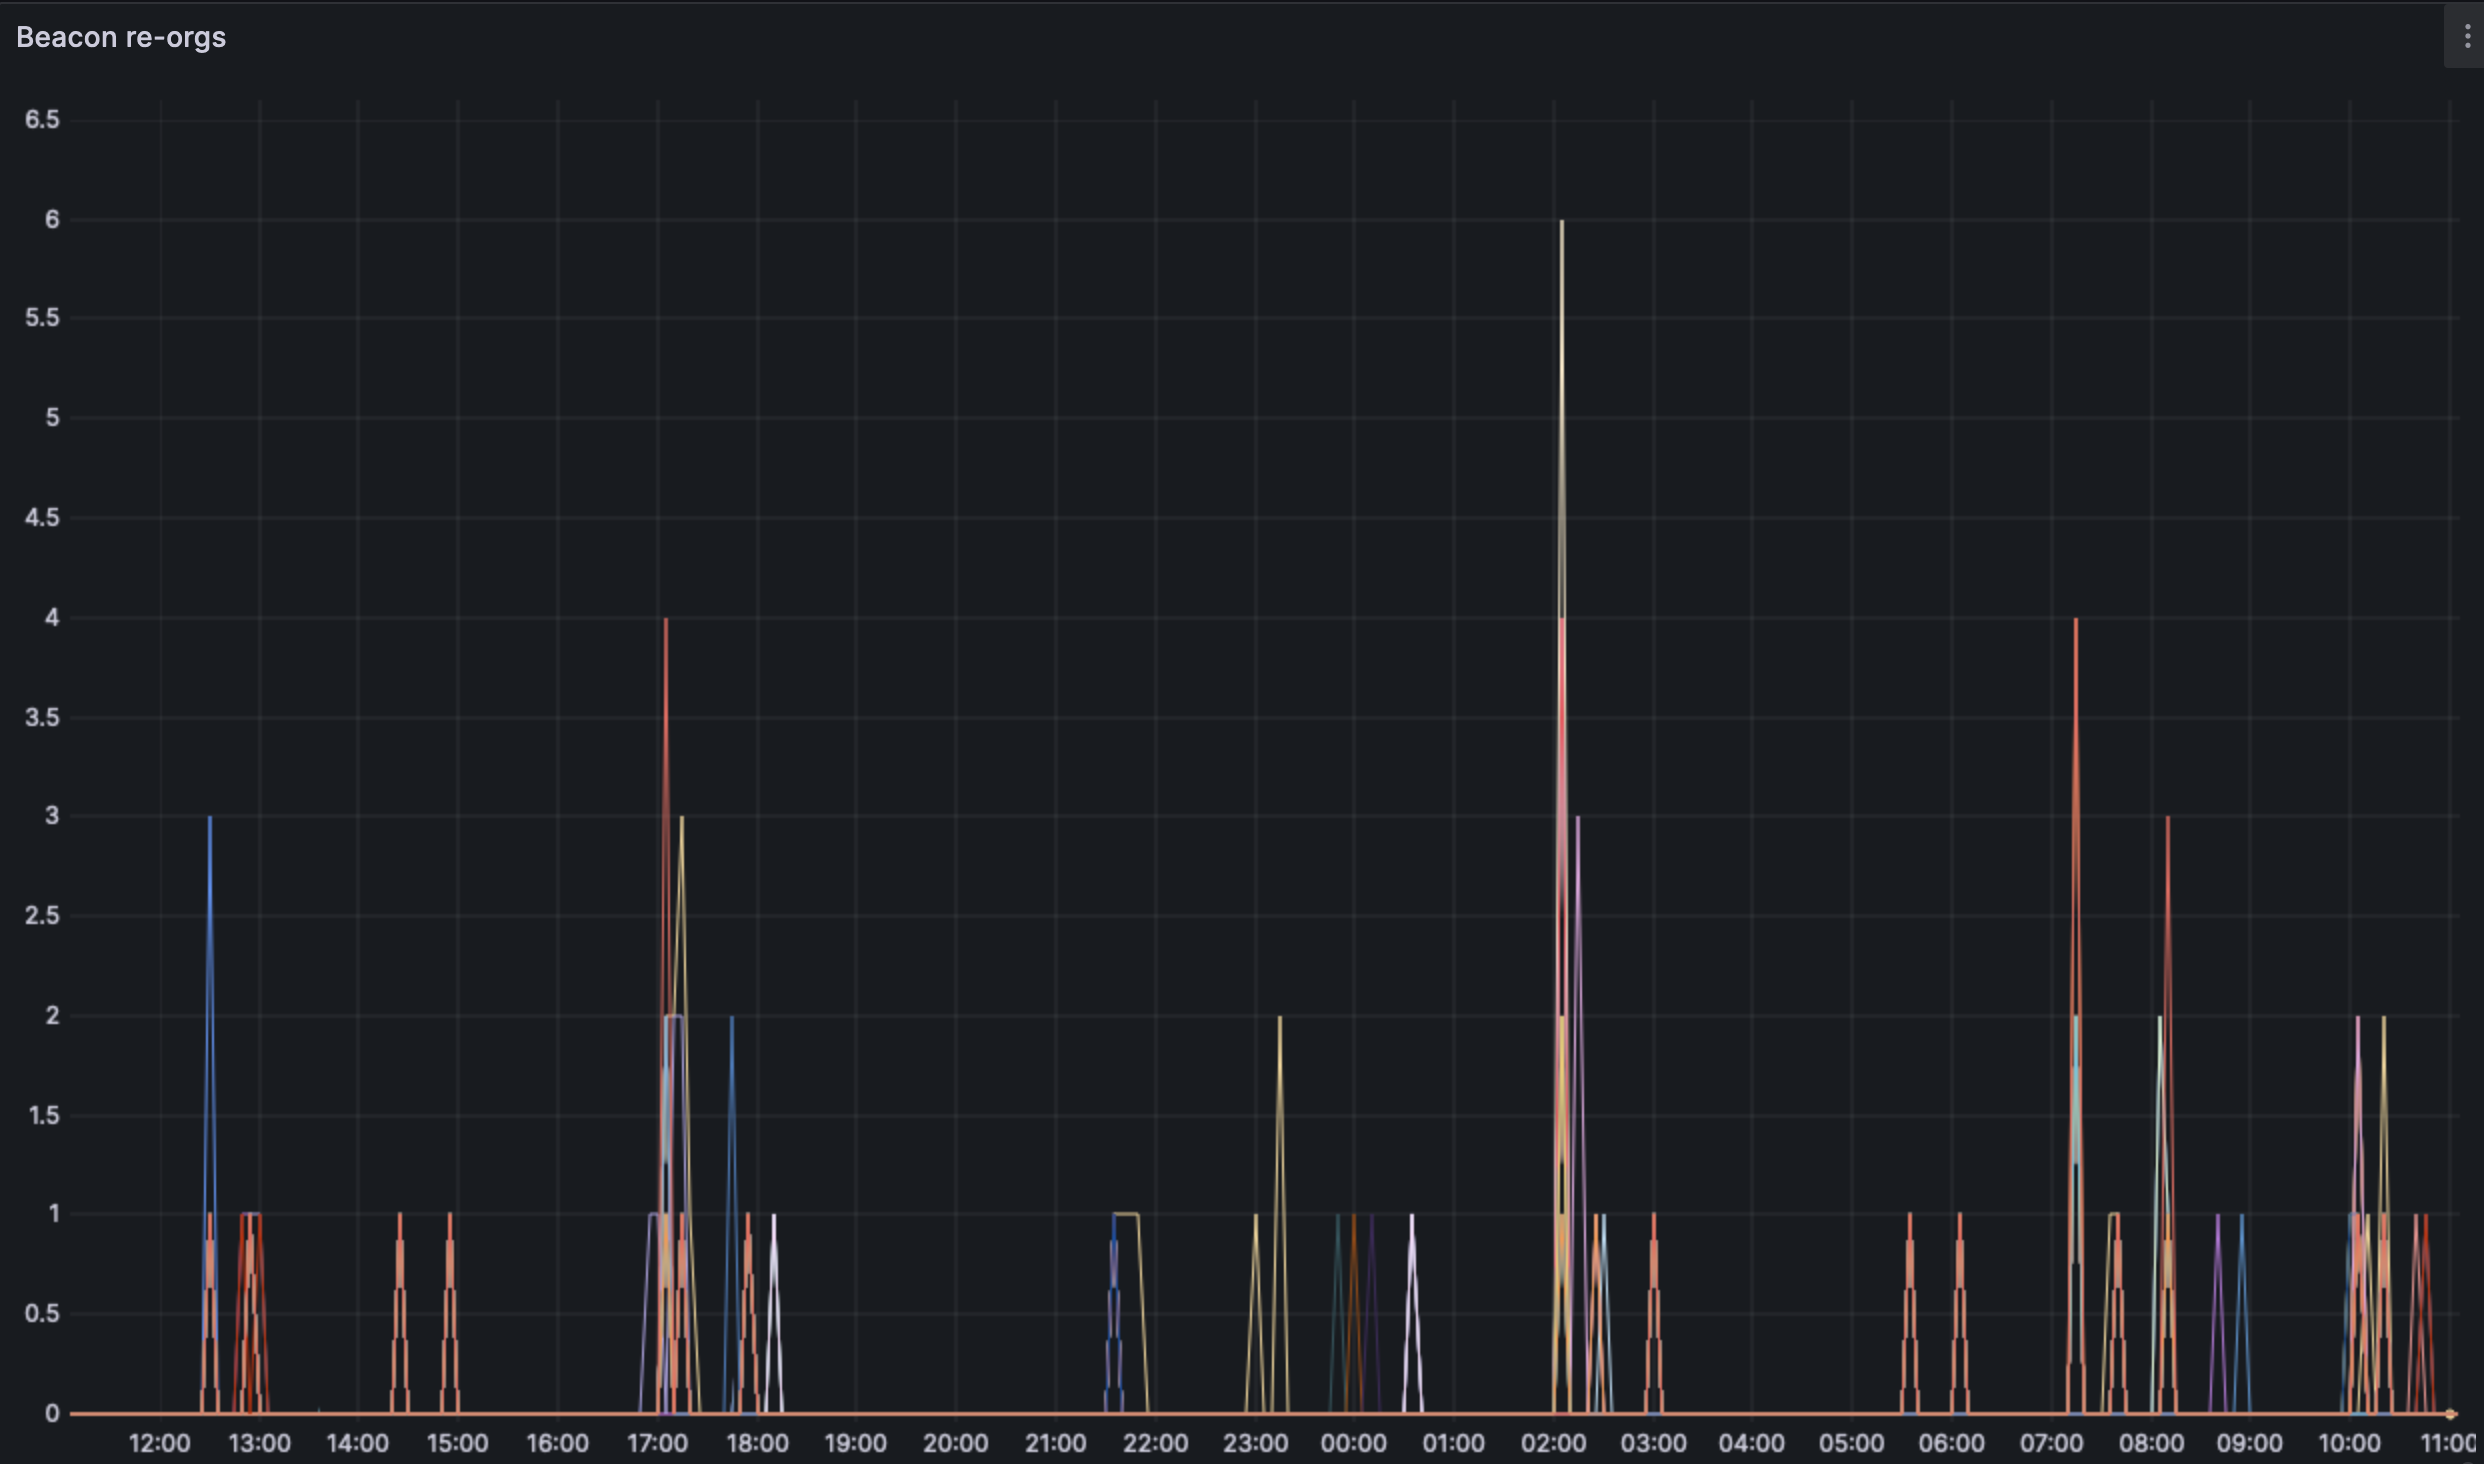
We see an increase in the depth of the reorgs. This is also likely related to the blobber more than the presence of more blobs.
## Blob analysis
Blob data was collected via Xatu with the same sentries as the baseline analsysis.
**Note: The blob spammers currently are run at a rate to achieve 5-6 blobs per slot. This is deemed close enough to the target that we should see stressed client performance. **
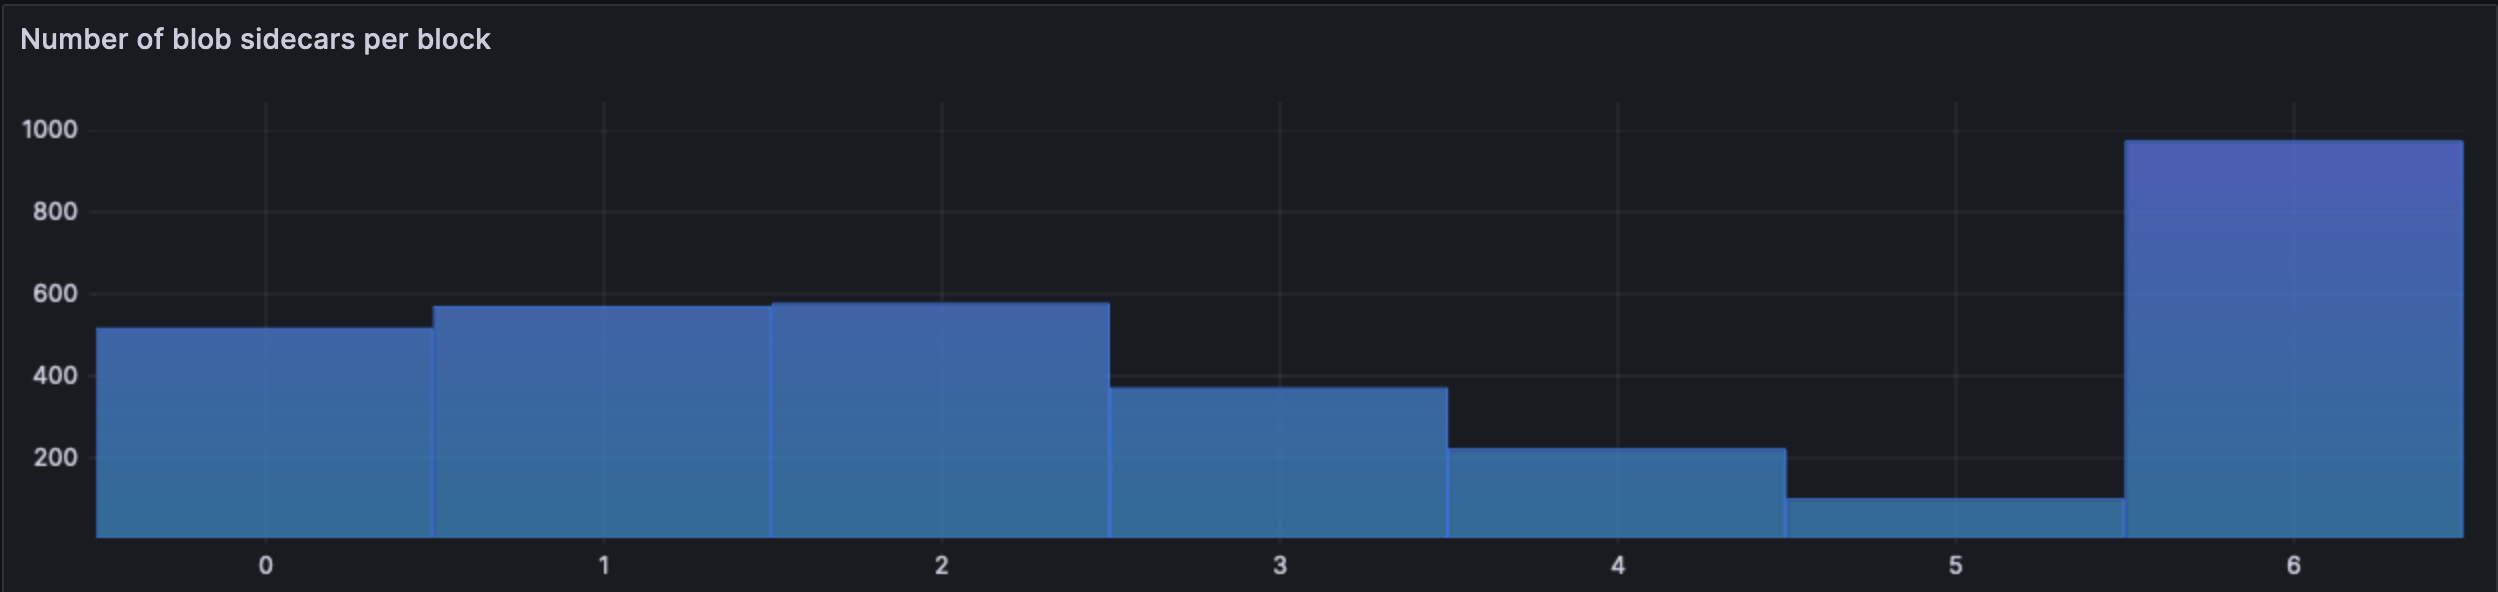
Since the blob spamming began, we can see that most slots indeed contain 6 blobs.
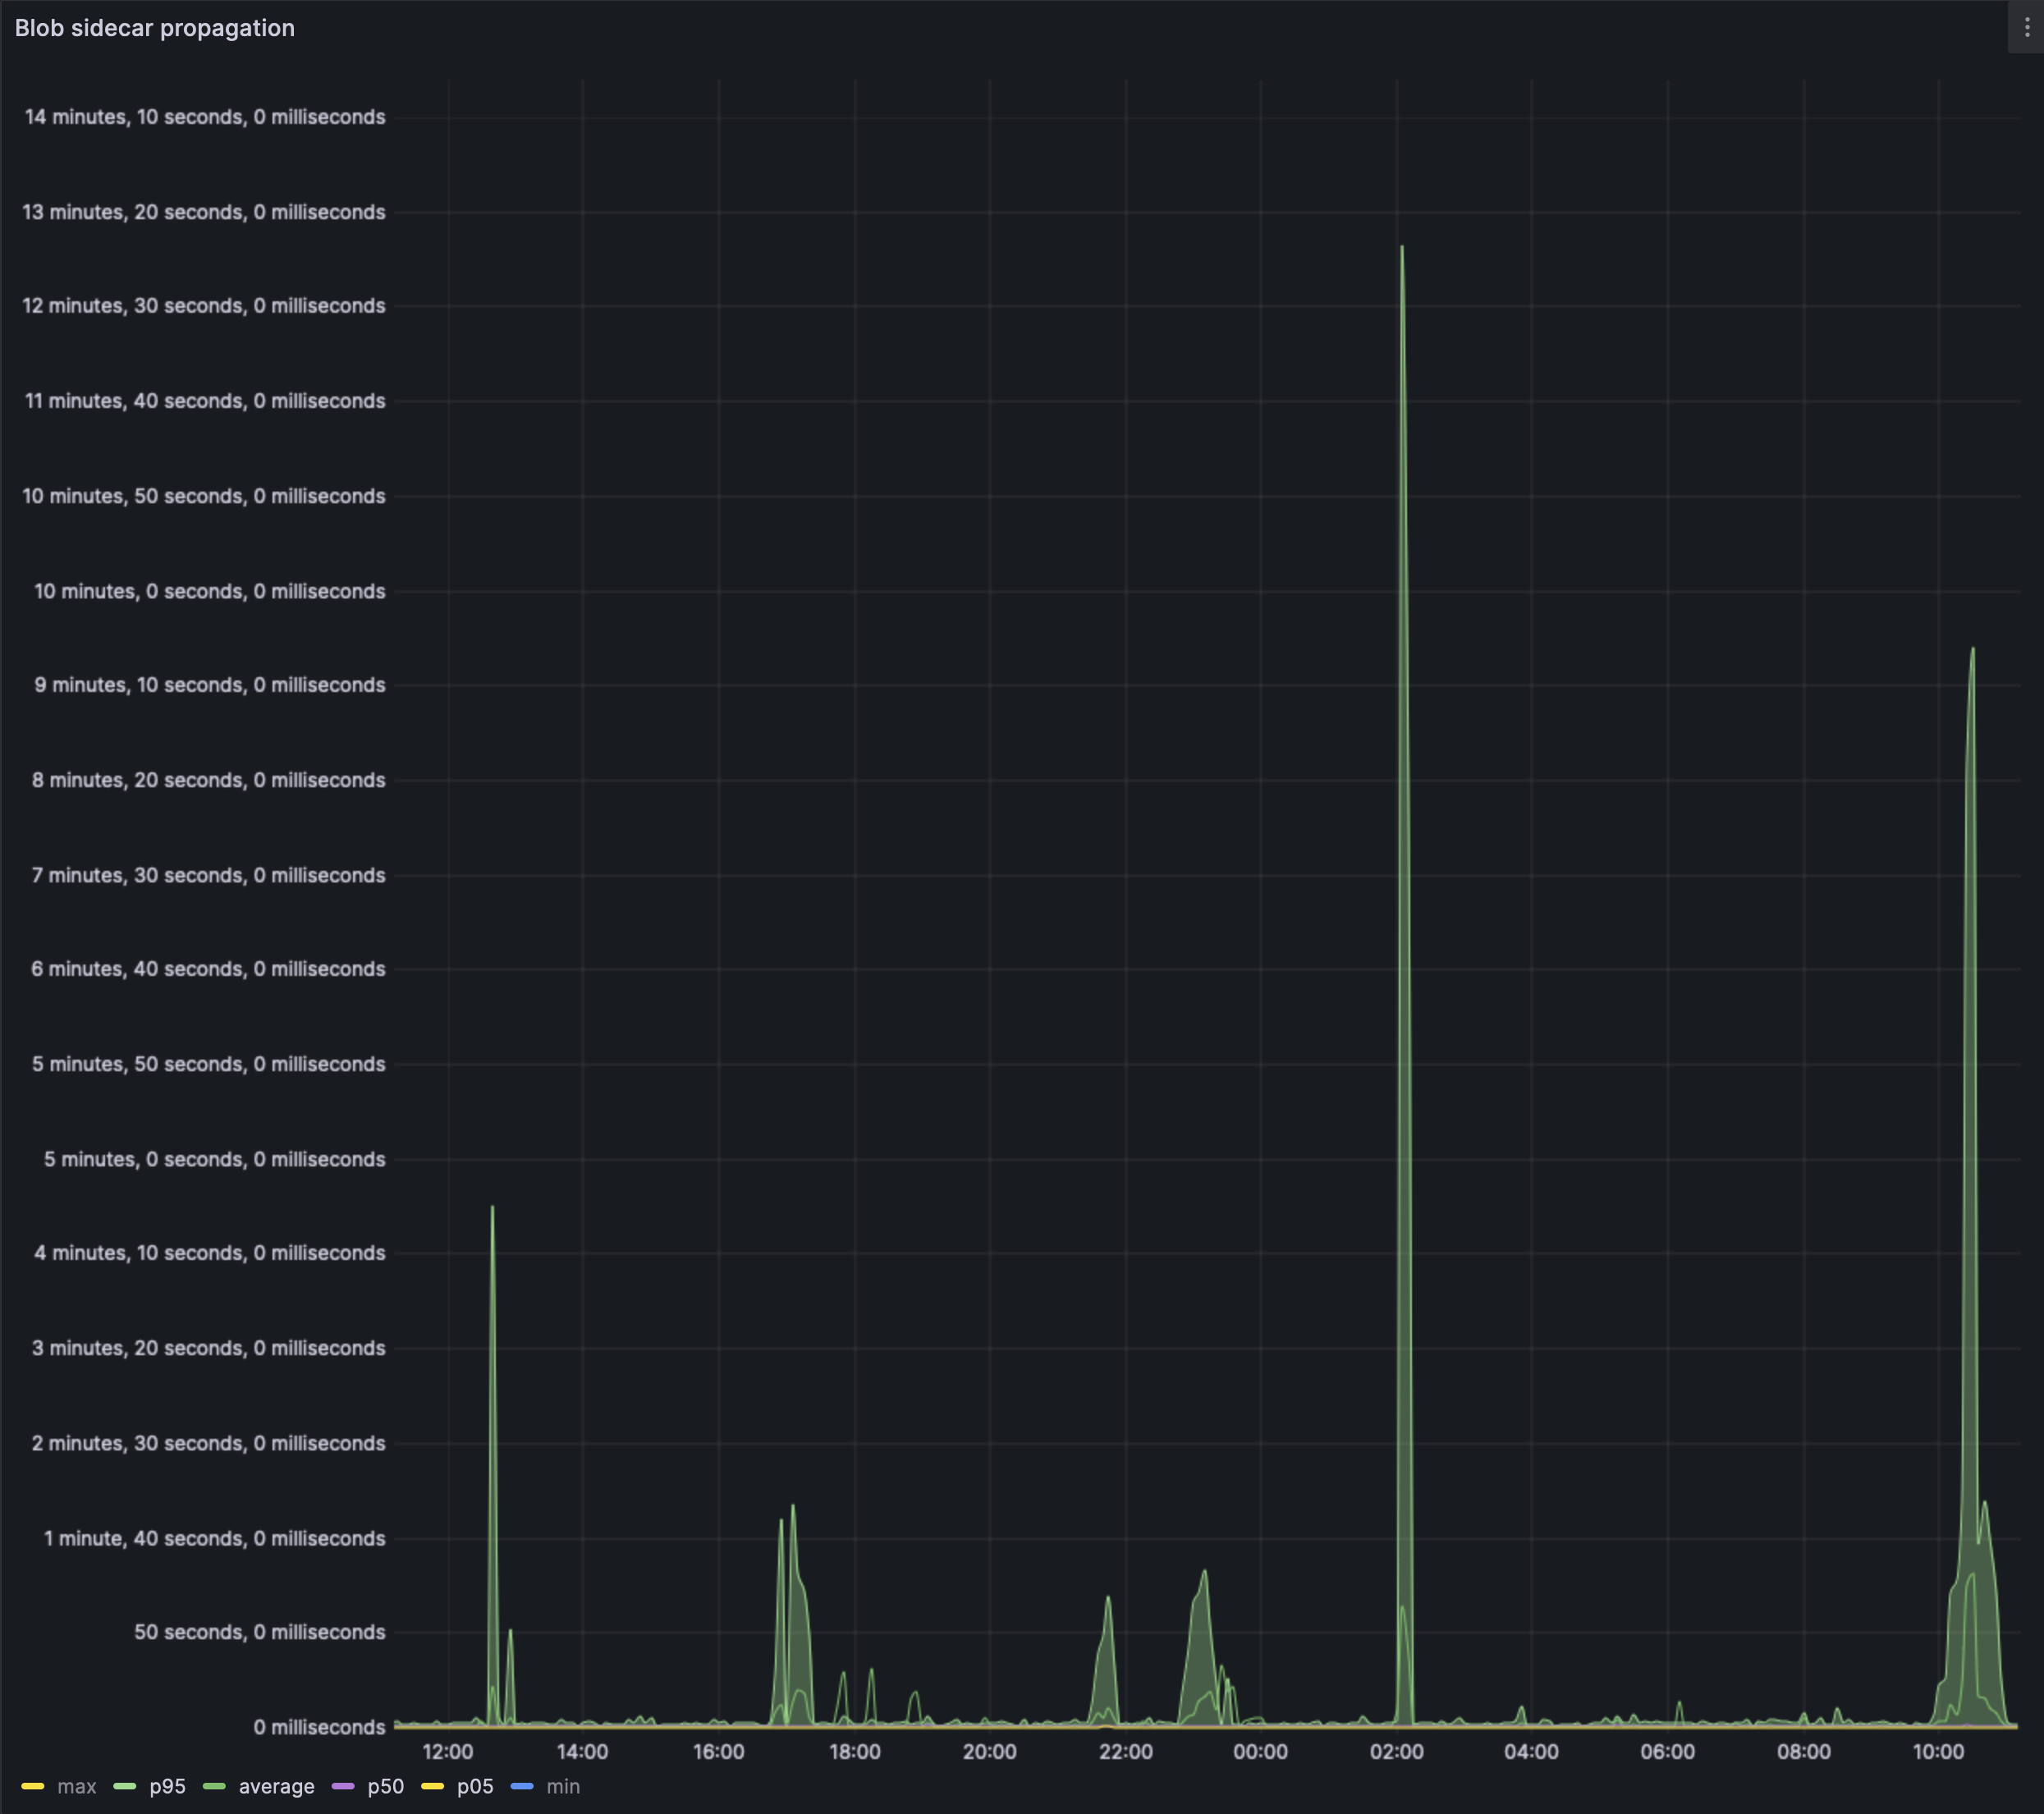
The `max` value of the chart has been filtered out as the value was skewing readability. Its still unclear if the invalid blobber blobs are still skewing the result. But the p95 propagation times are indeed cause for concern unless we can find an explanation.
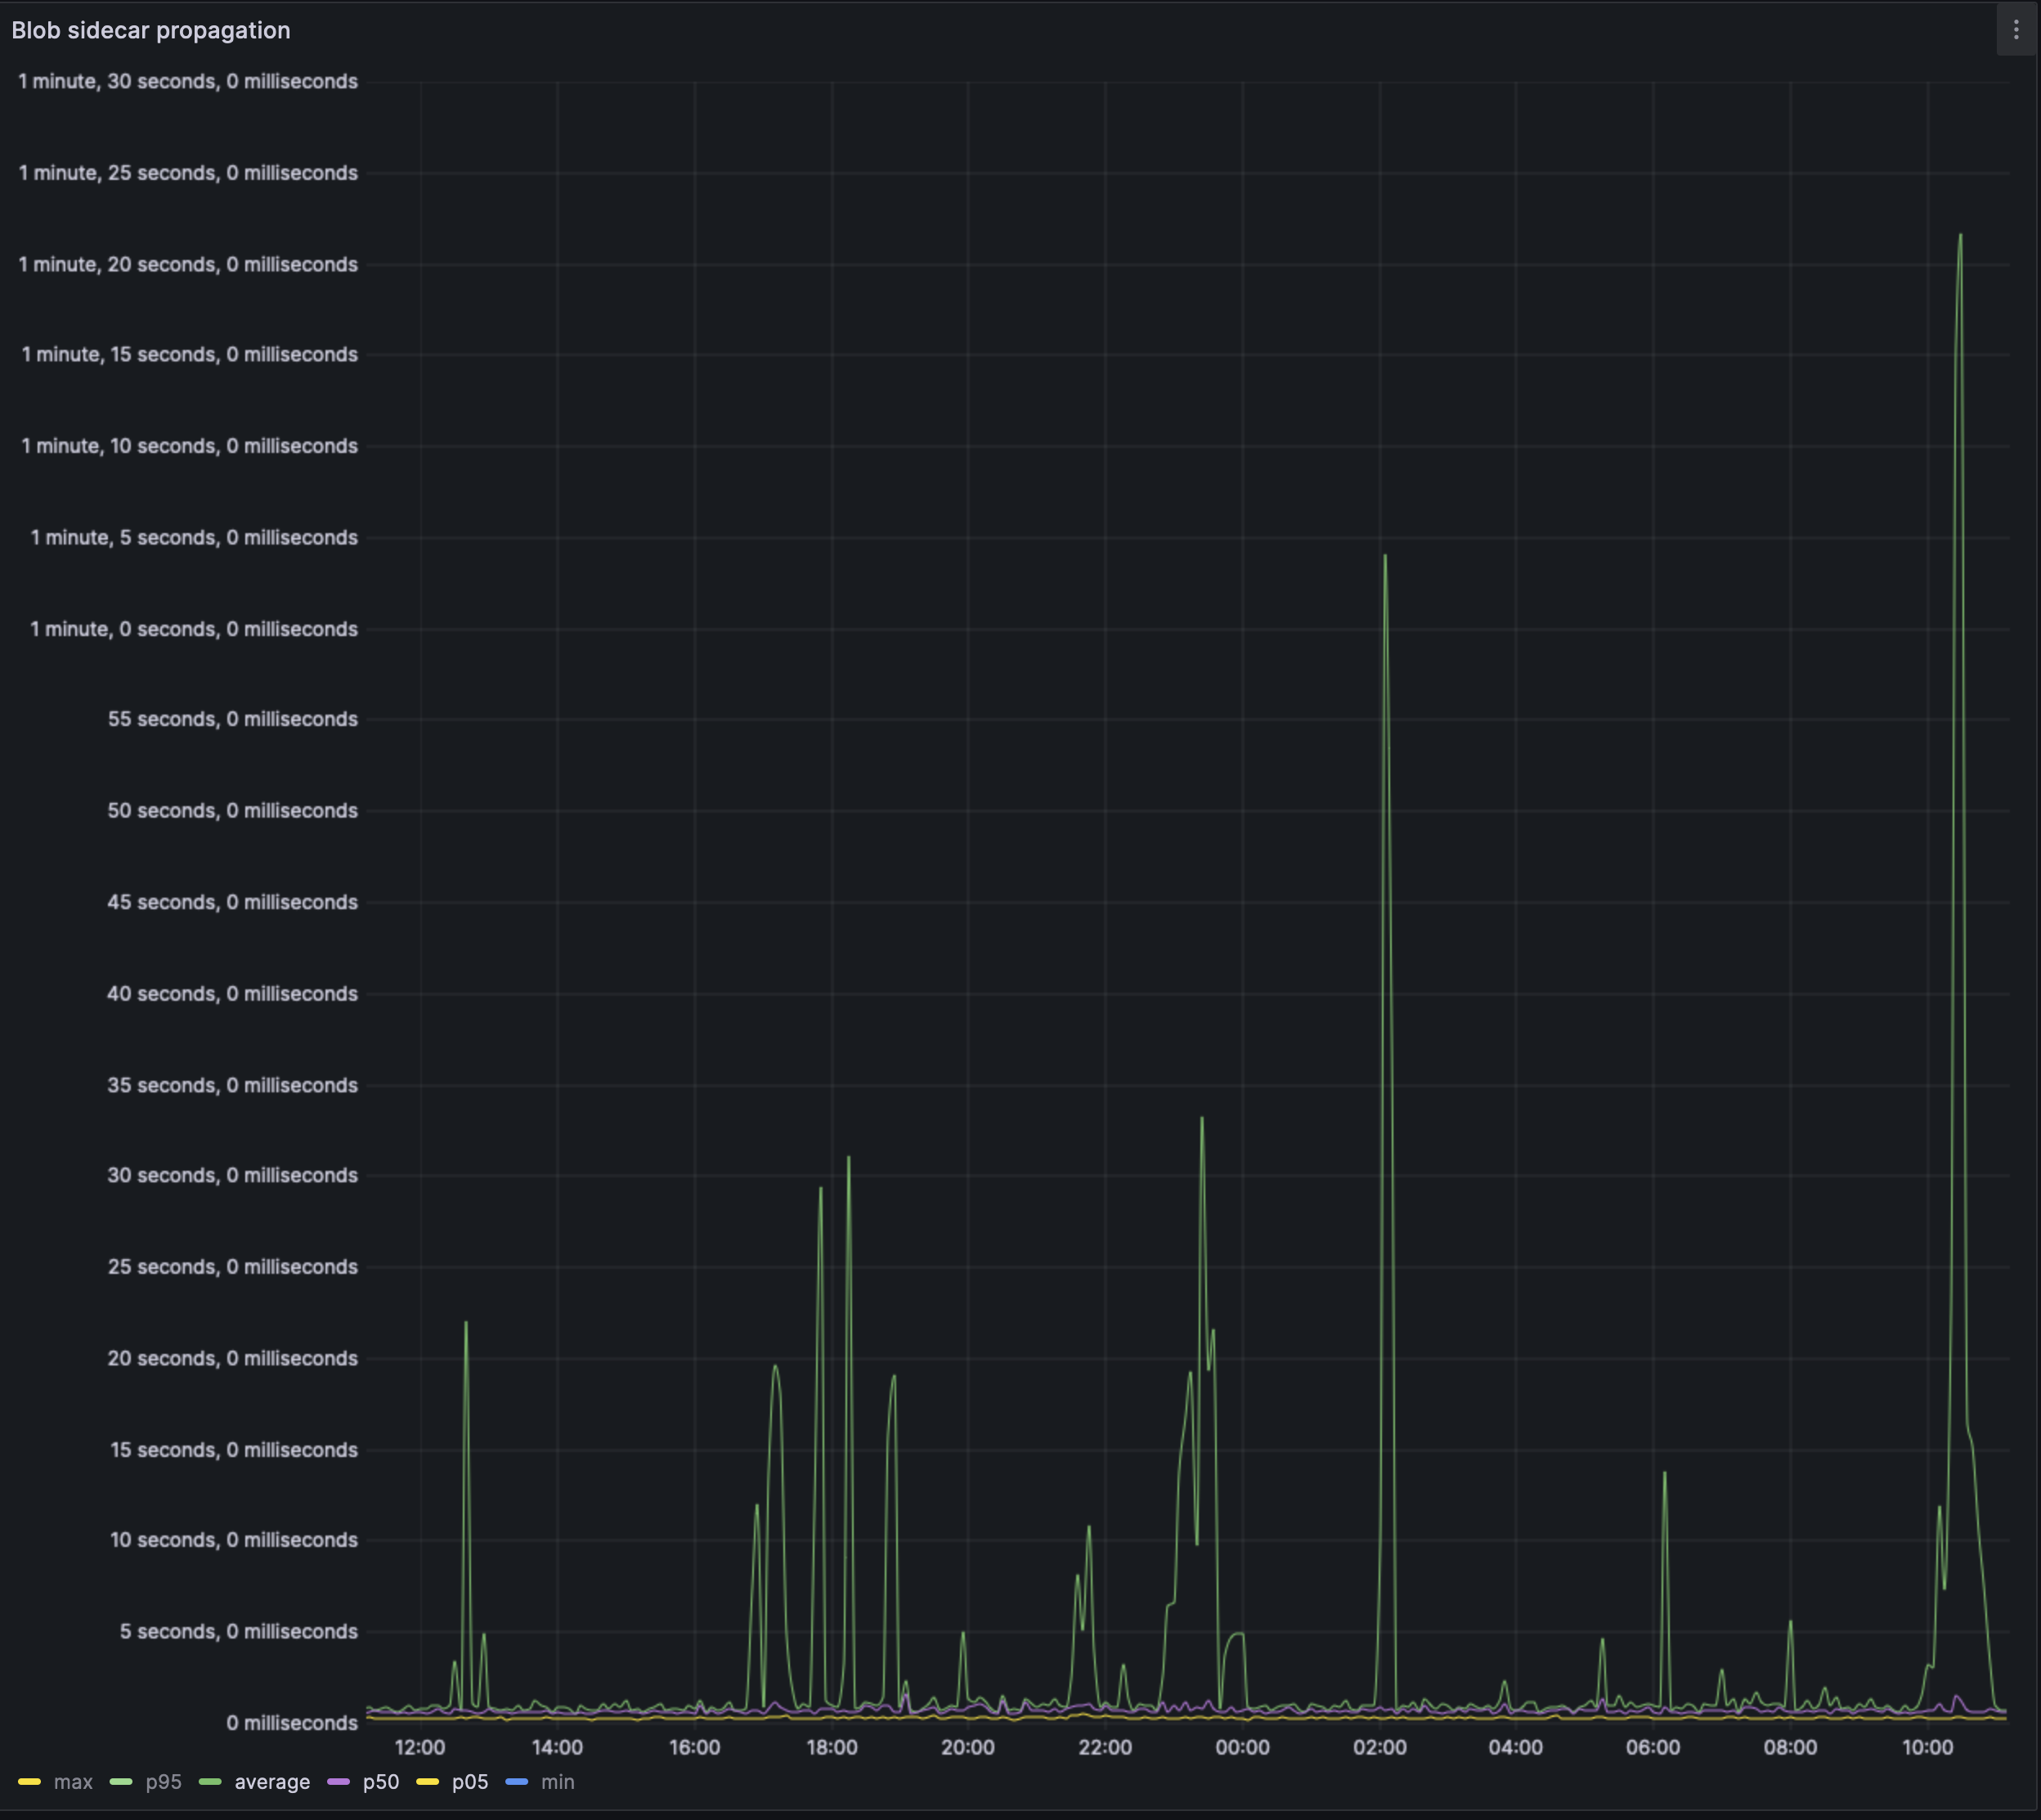
The average case might be a better metric to look at right now. But even the average case indicates a sharp increase in propagation time across the network as the blob spammer increased its load.
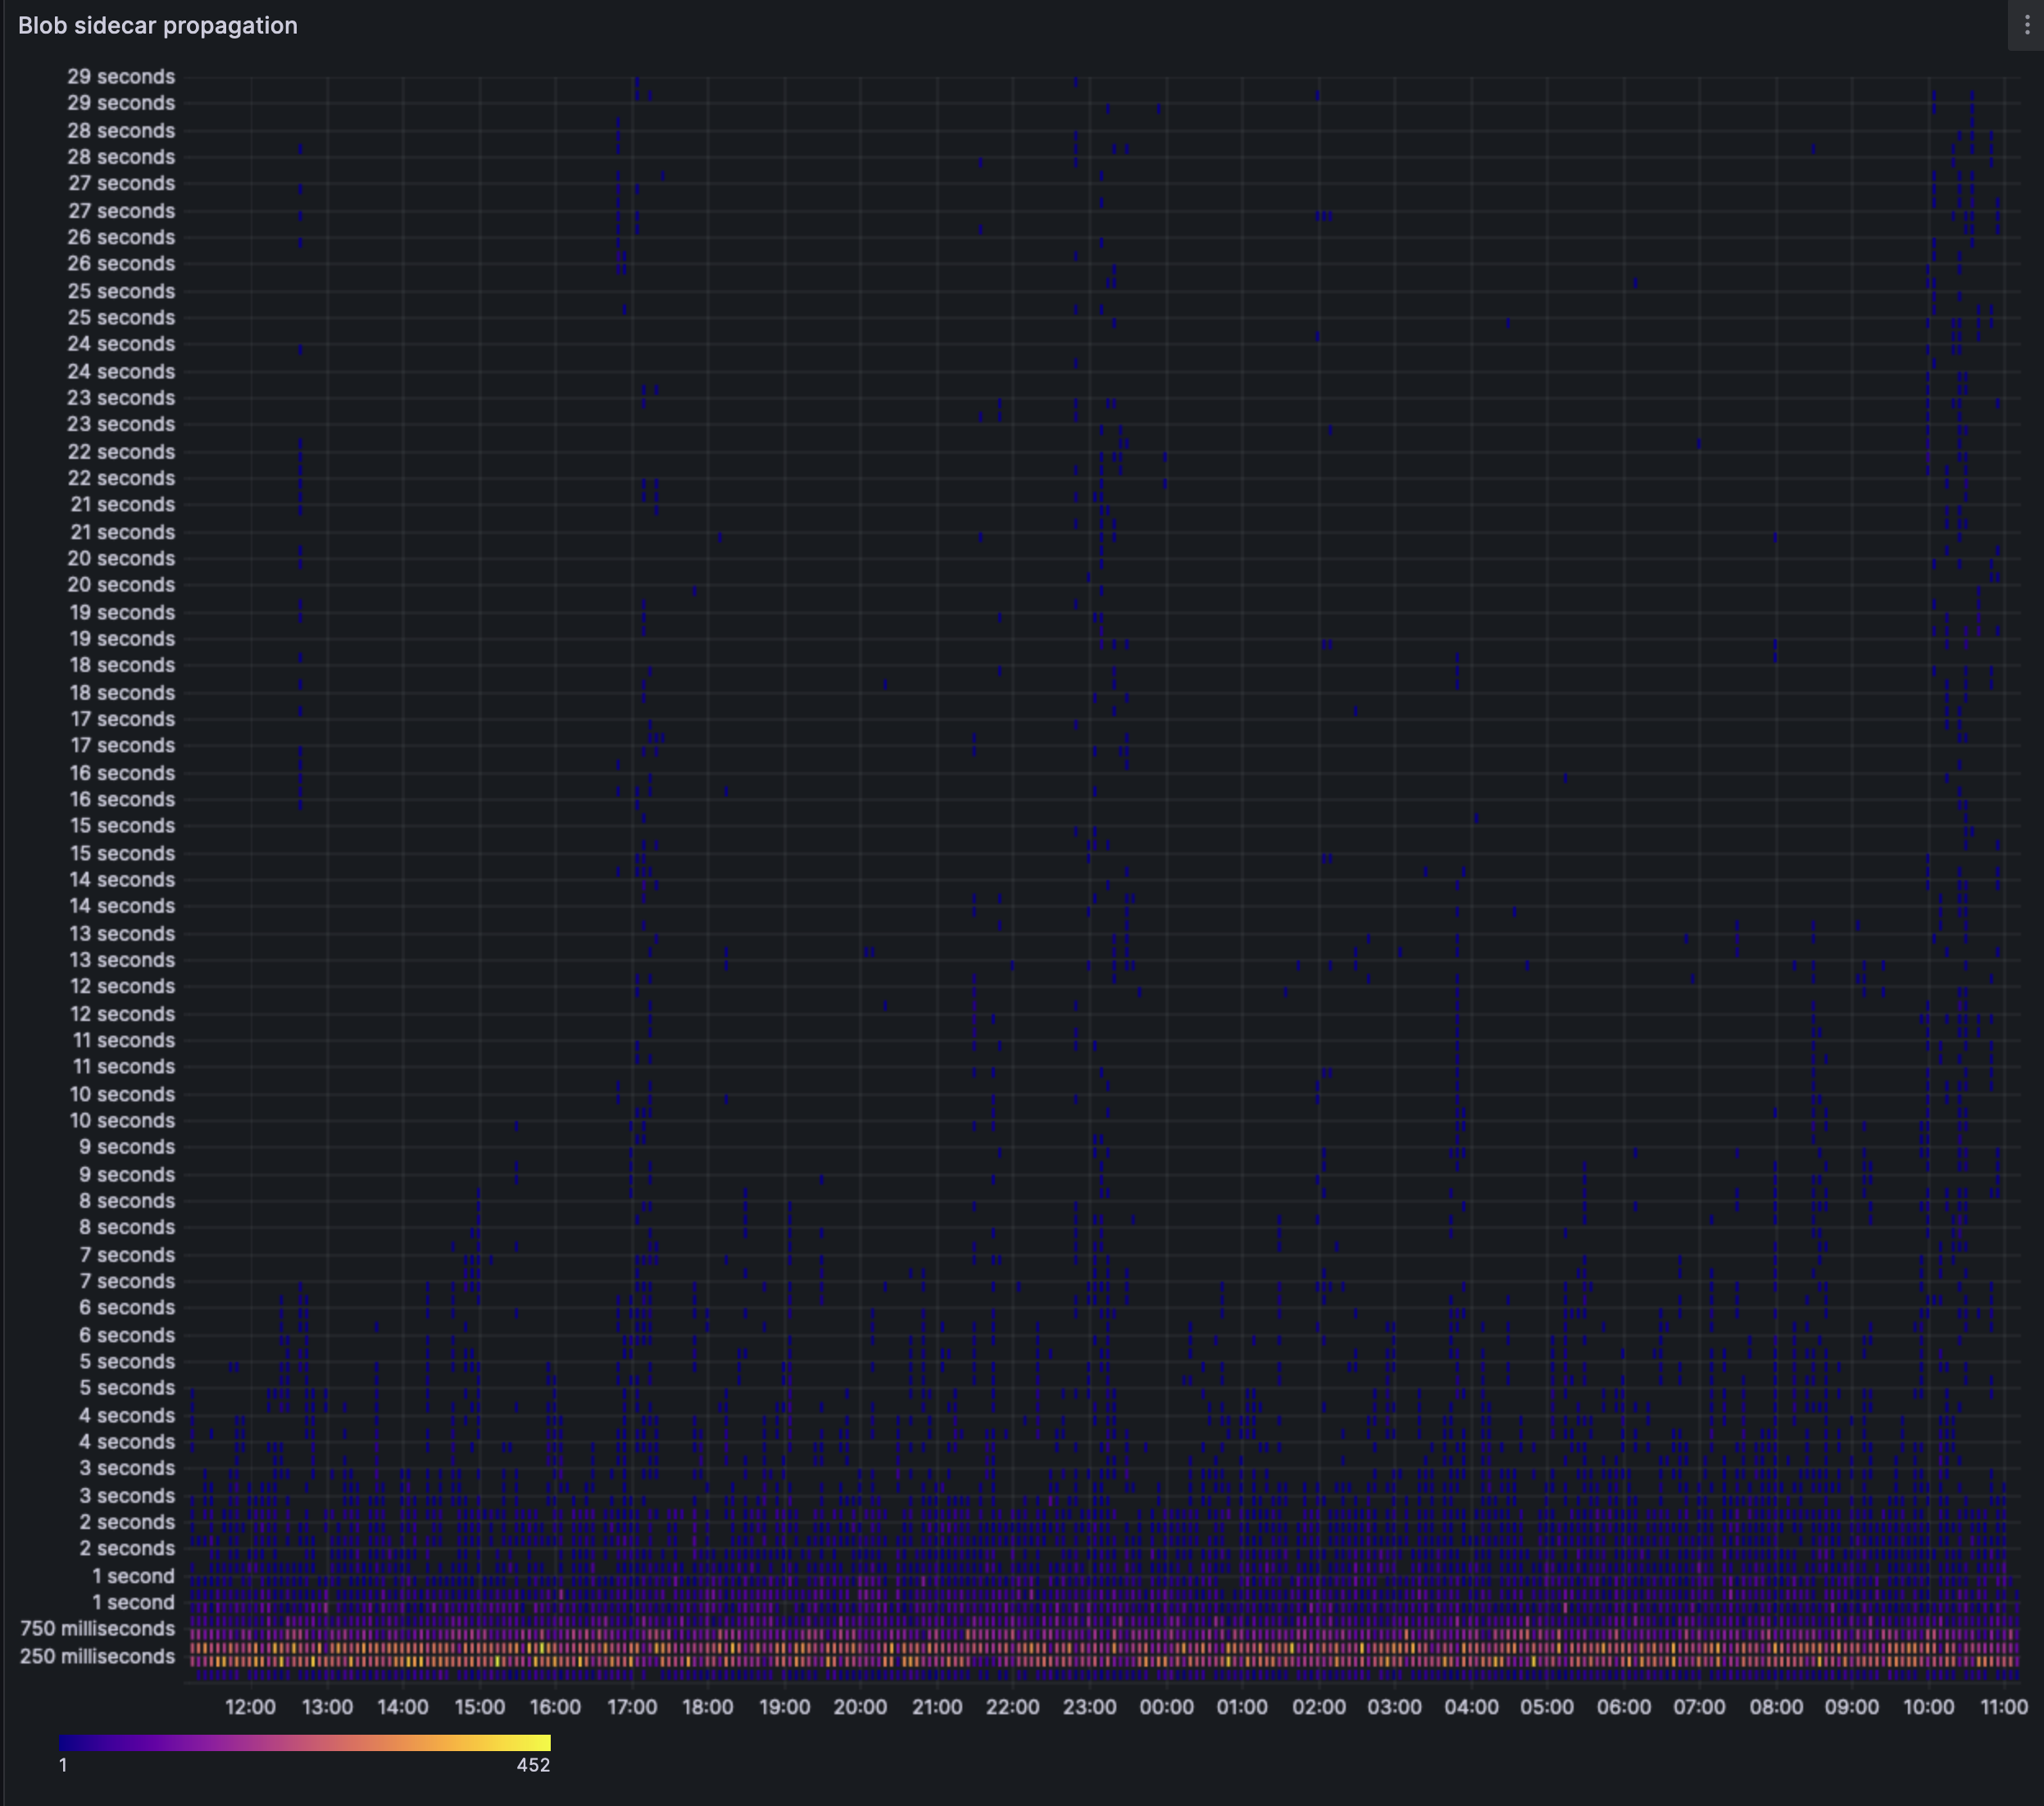
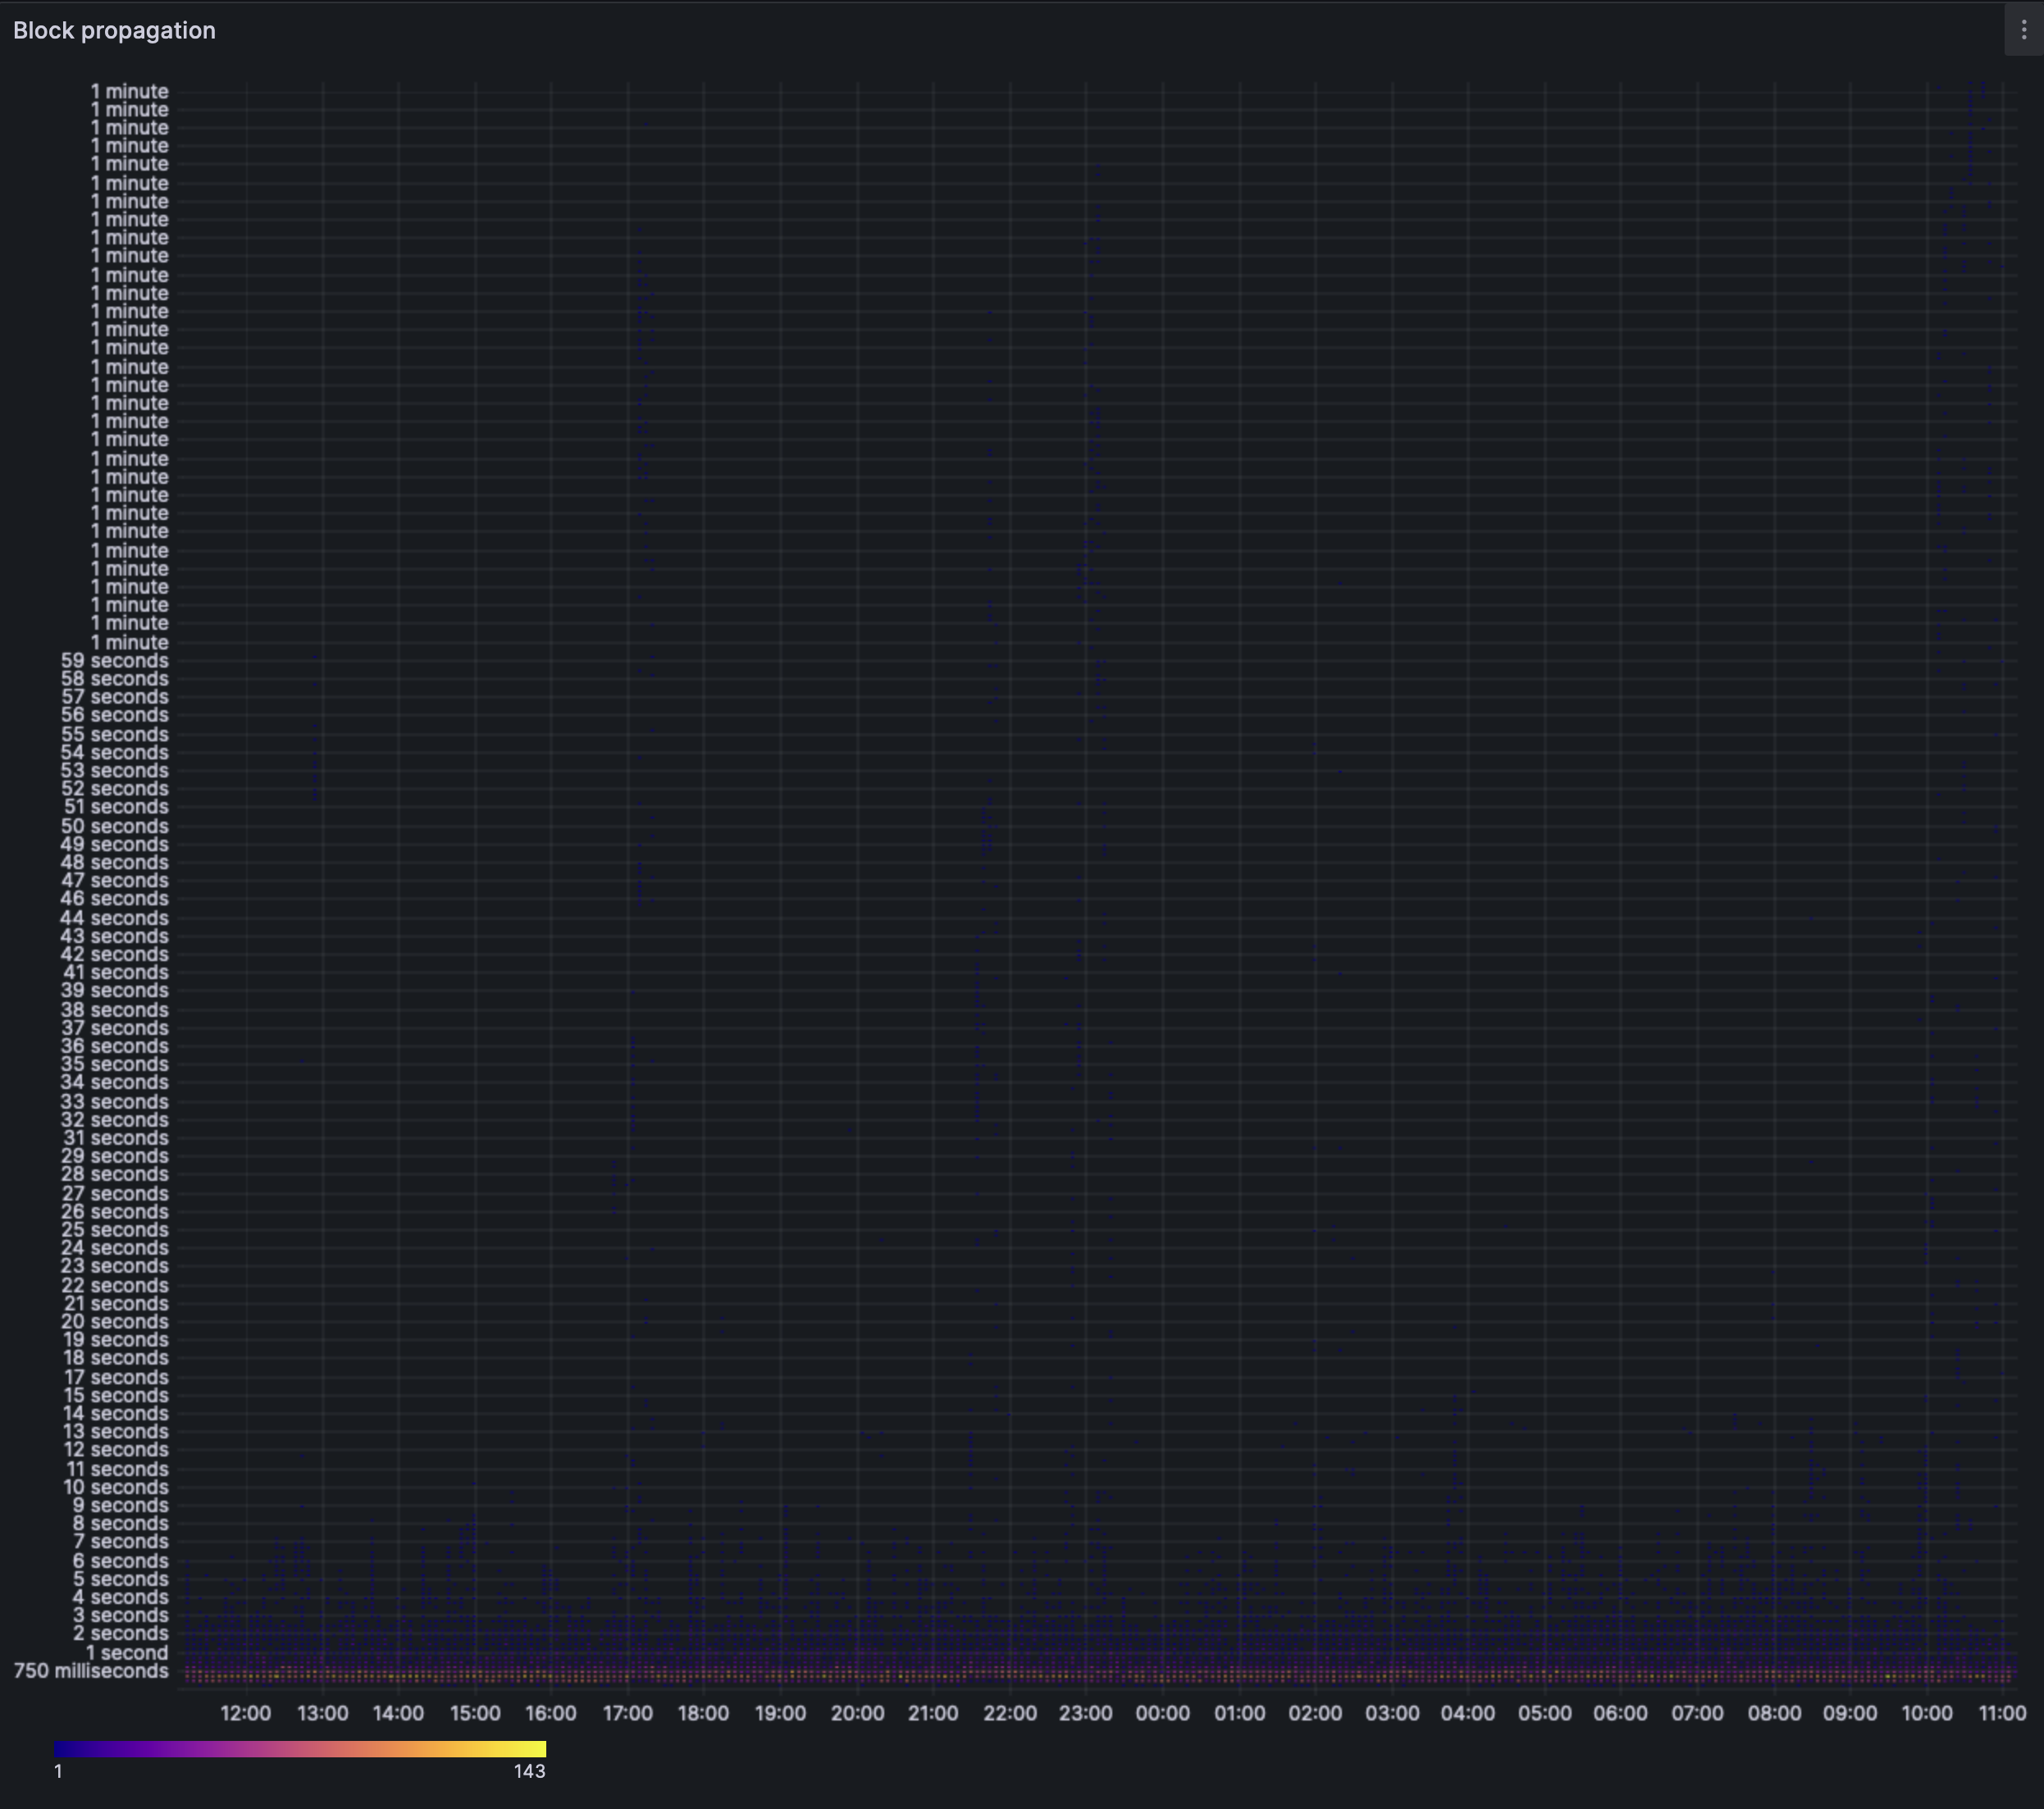
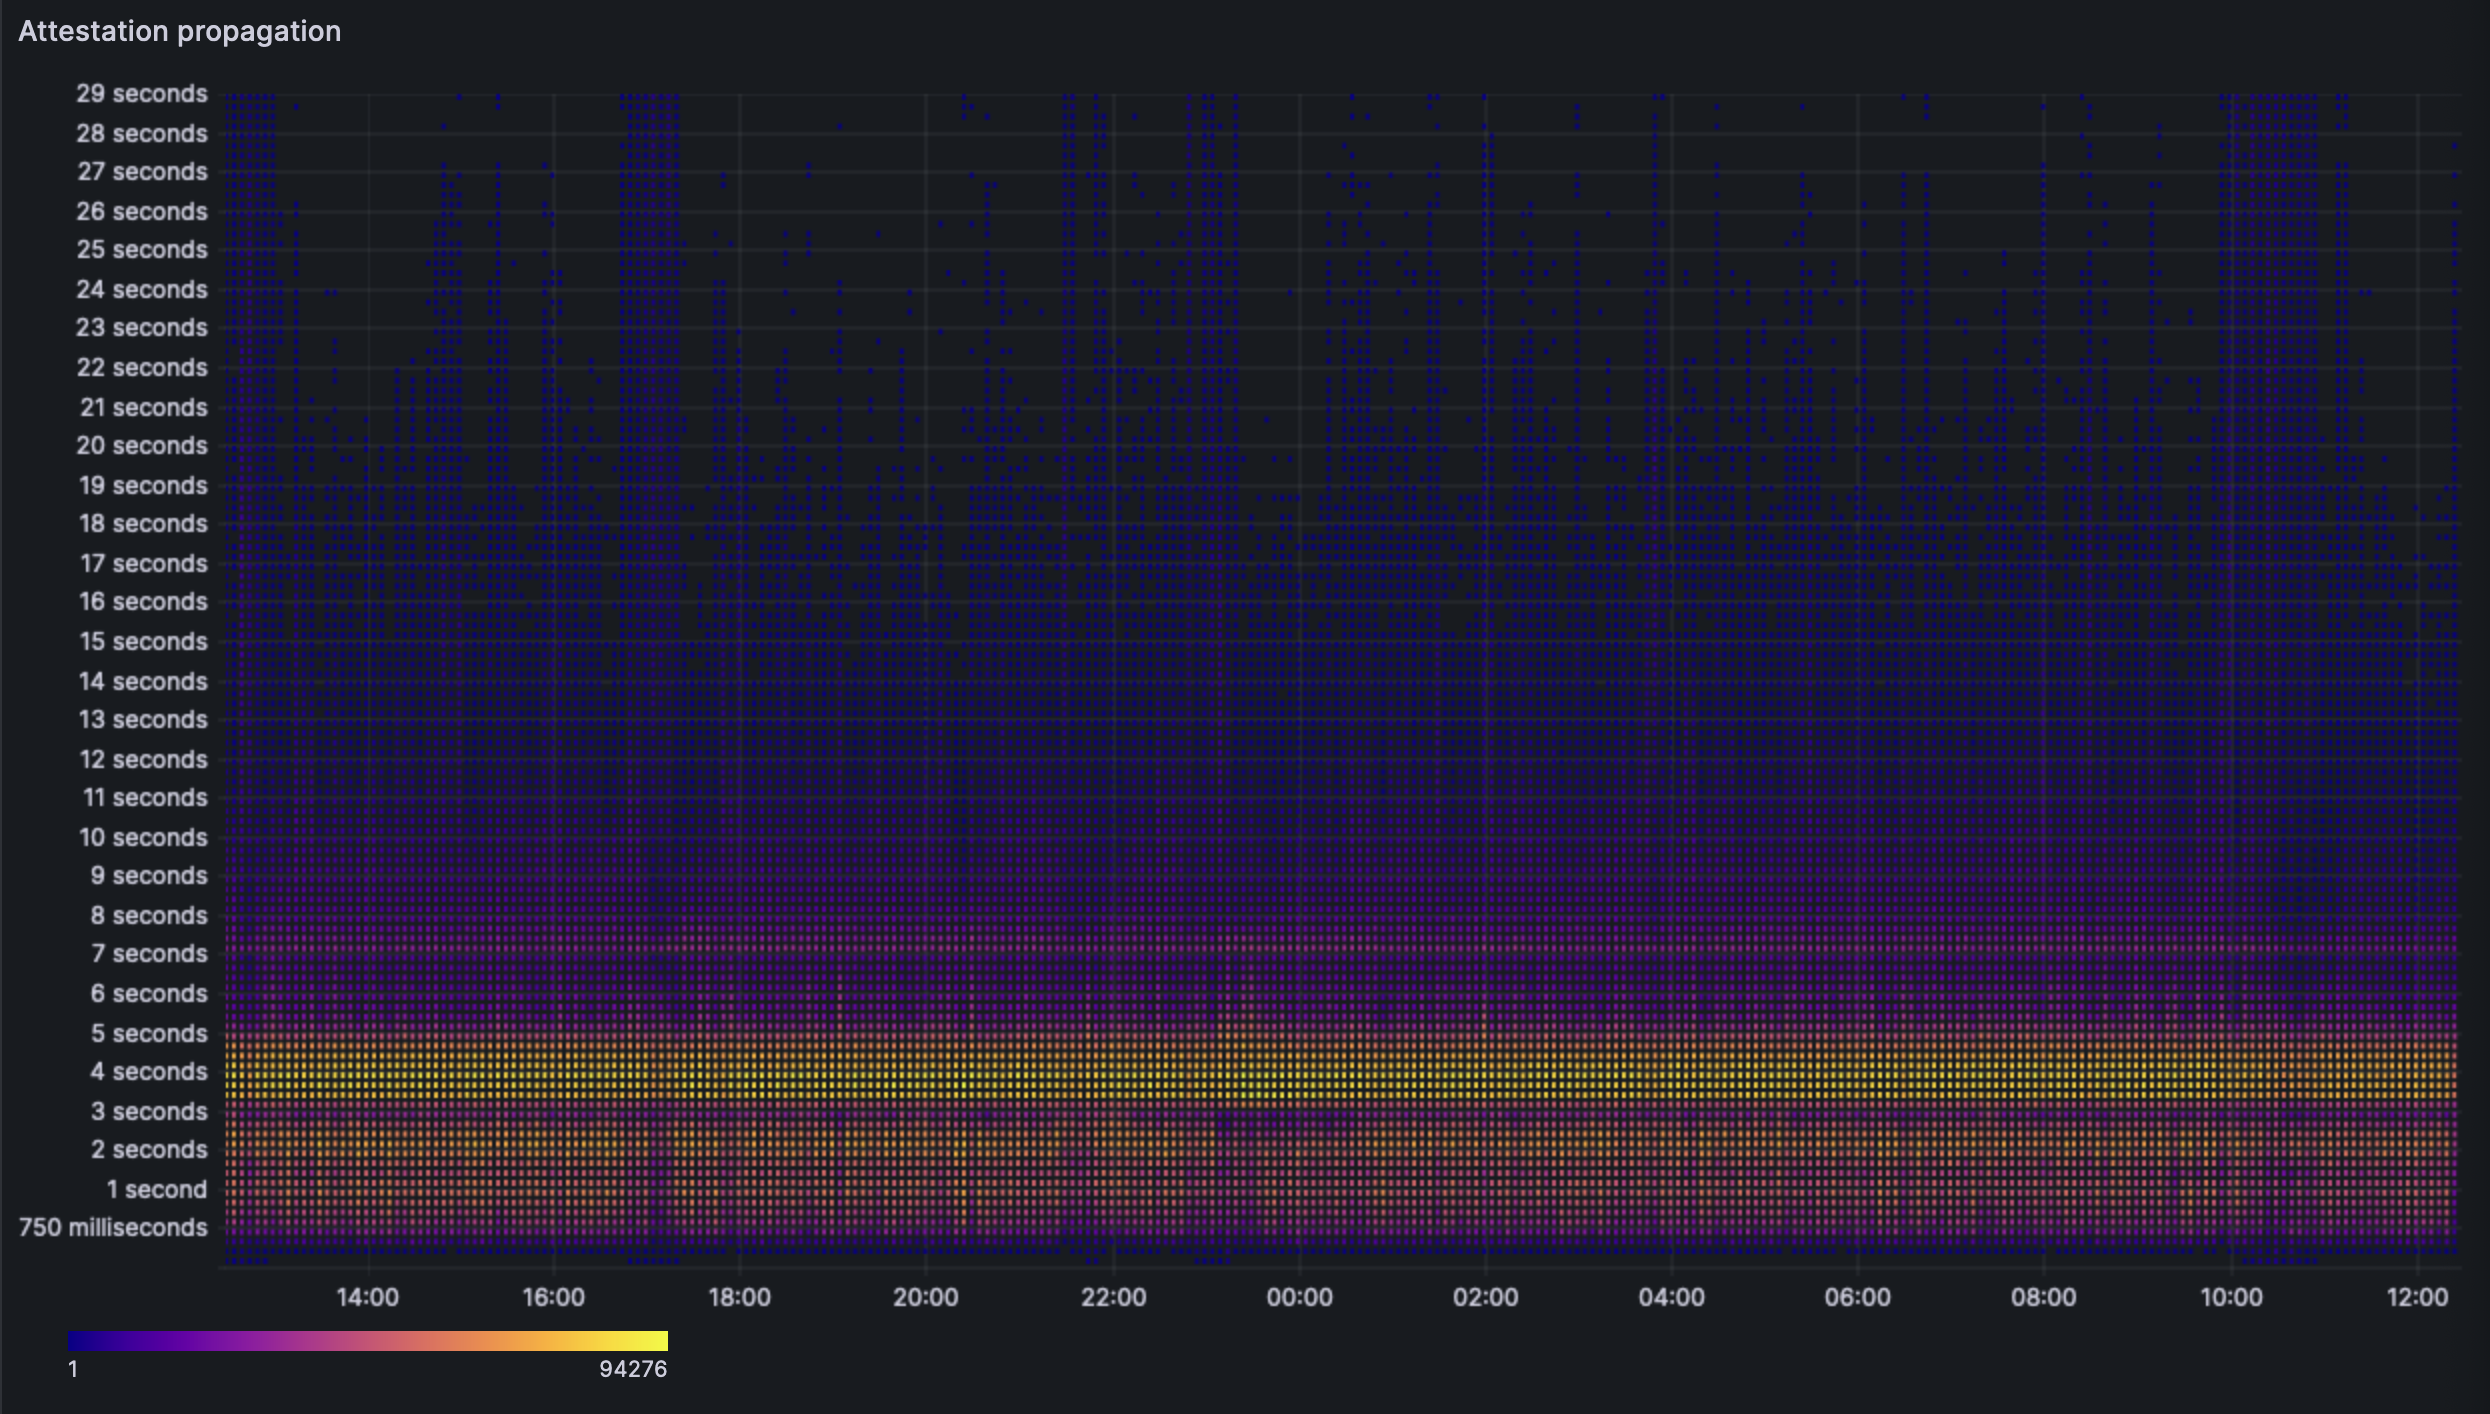
The heatmap is largely unchanged, most nodes do indeed seem to receive blobs within the 250ms->750ms mark. However the extremes seem more pronounced, with the baseline extreme being 14s and the stress extreme being 29s.
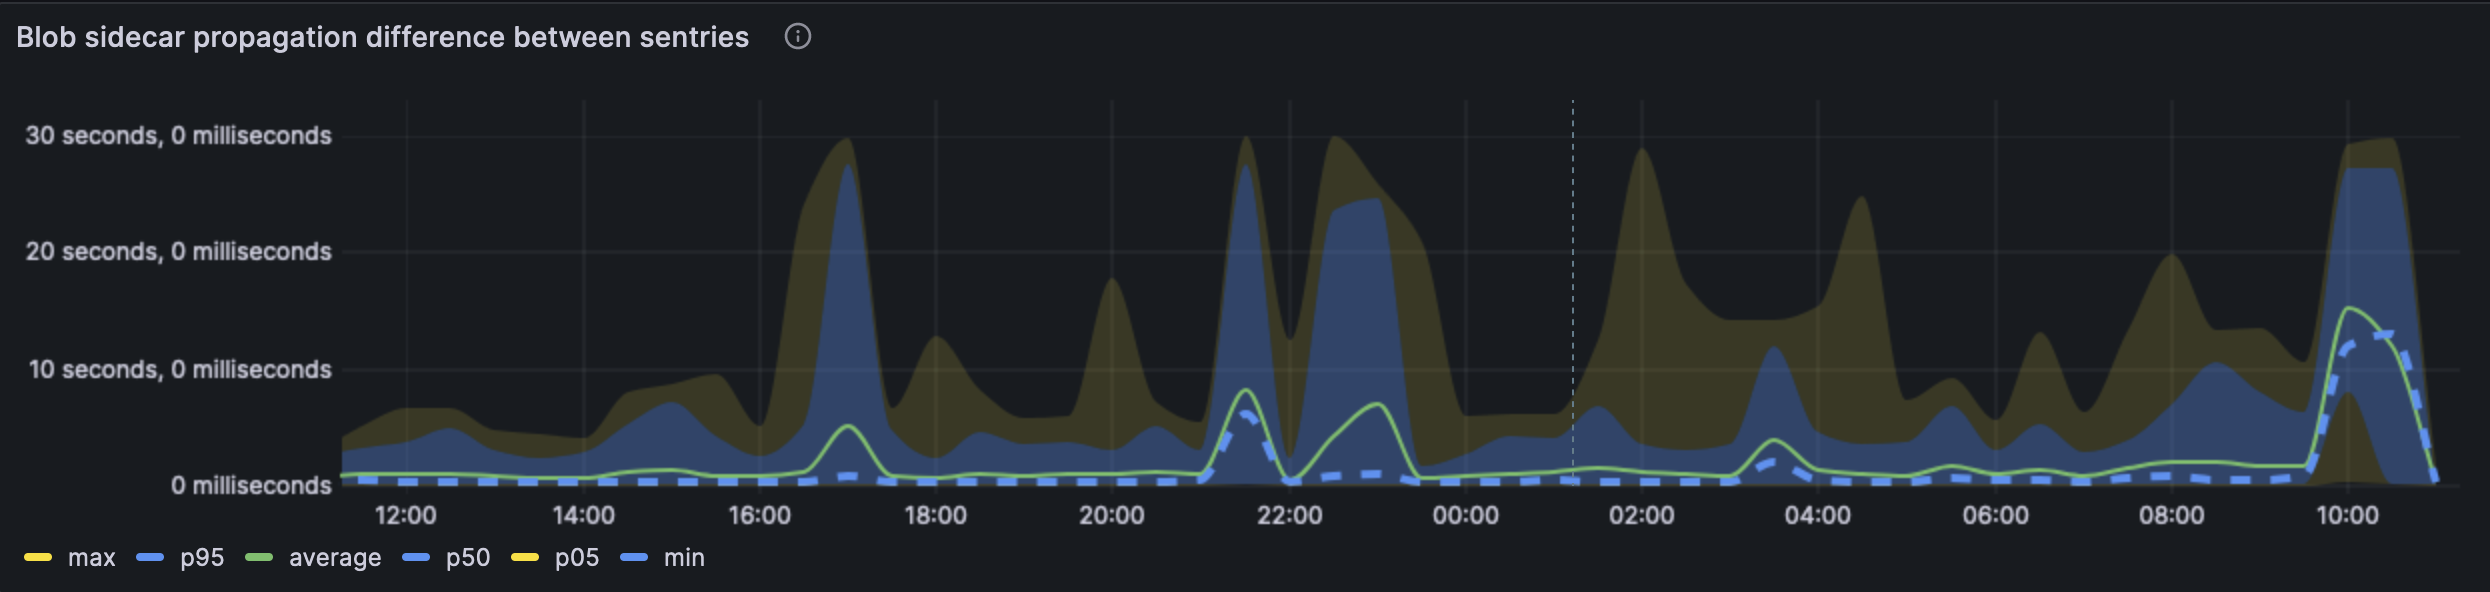
The propagation between sentries tells us the same story. We're able to see that the extremes are wider but the average case stays under 1s.
We see higher max values (up to 8s) and higher averages compared to the baseline. The baseline average for 6 blobs was 850ms whereas we are seeing 1.08ms in the stressed approach.
## Block/attestation analysis:
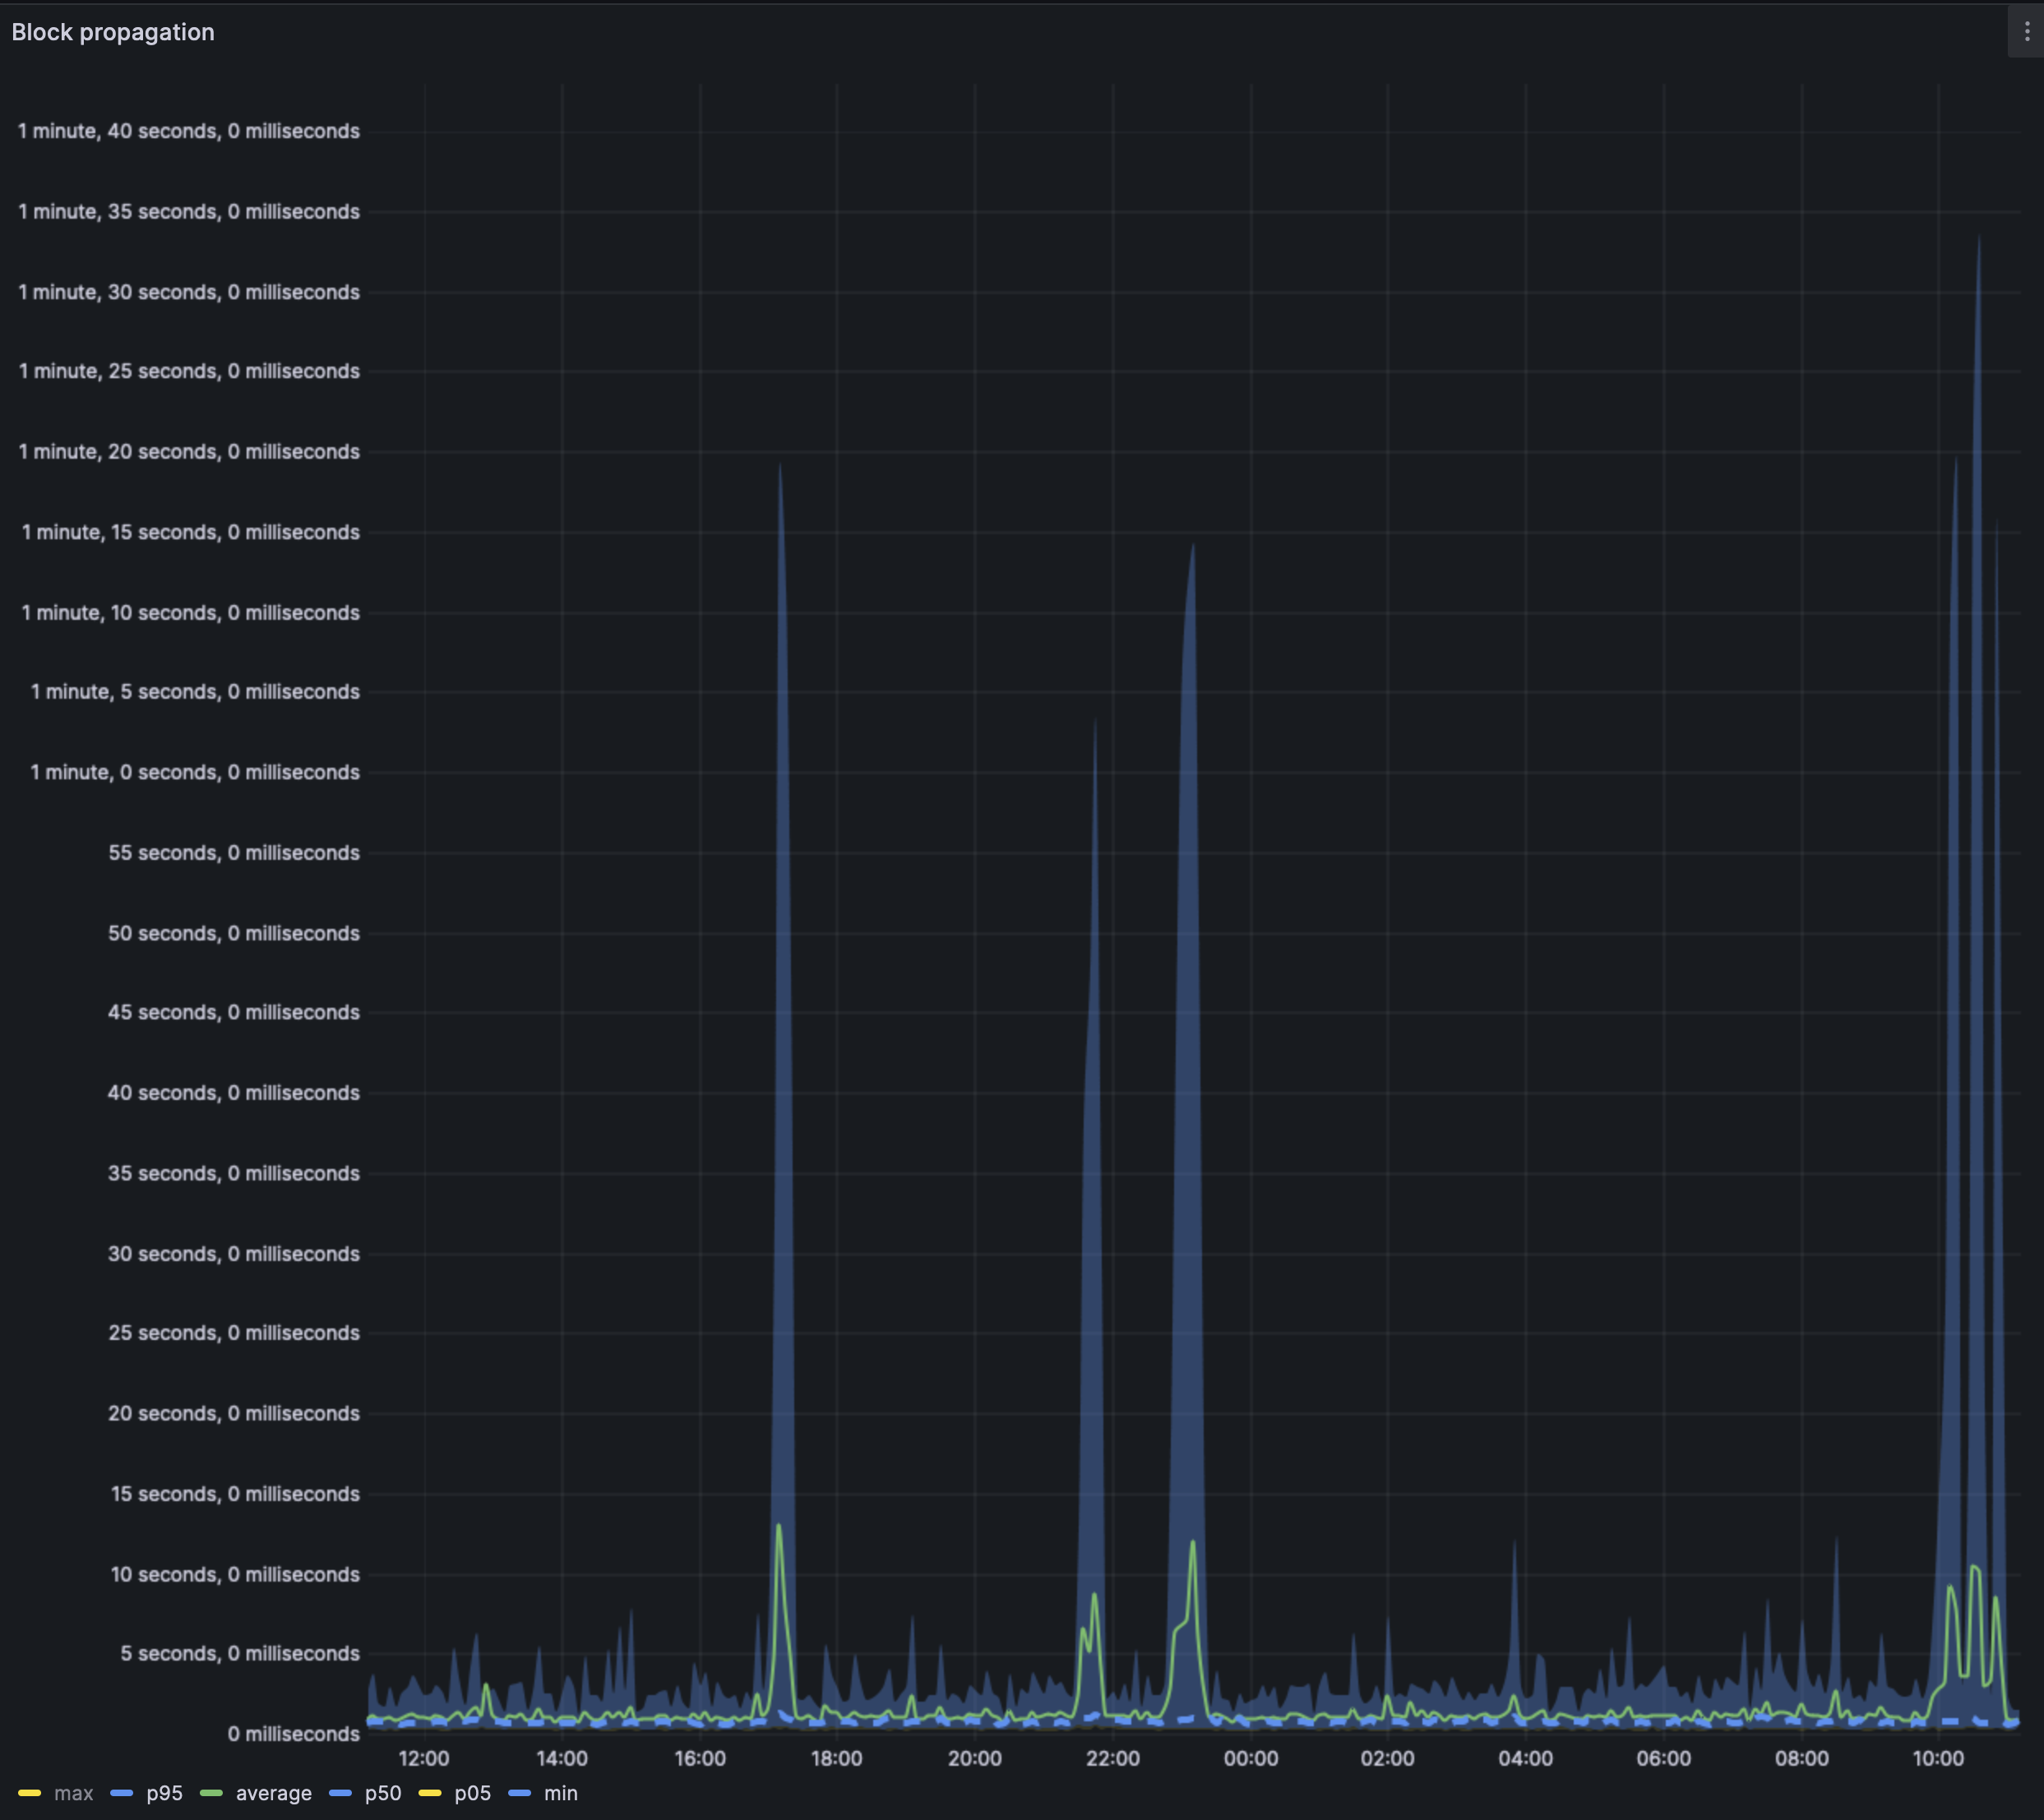
Block propagation times seem to have sometimes extremely high values. Unsure of the reason yet.
The average case block propagation is still well under the 1s mark.
We see a similar trend of the extremes being wider and perhaps this is due to the higher reorg rate.
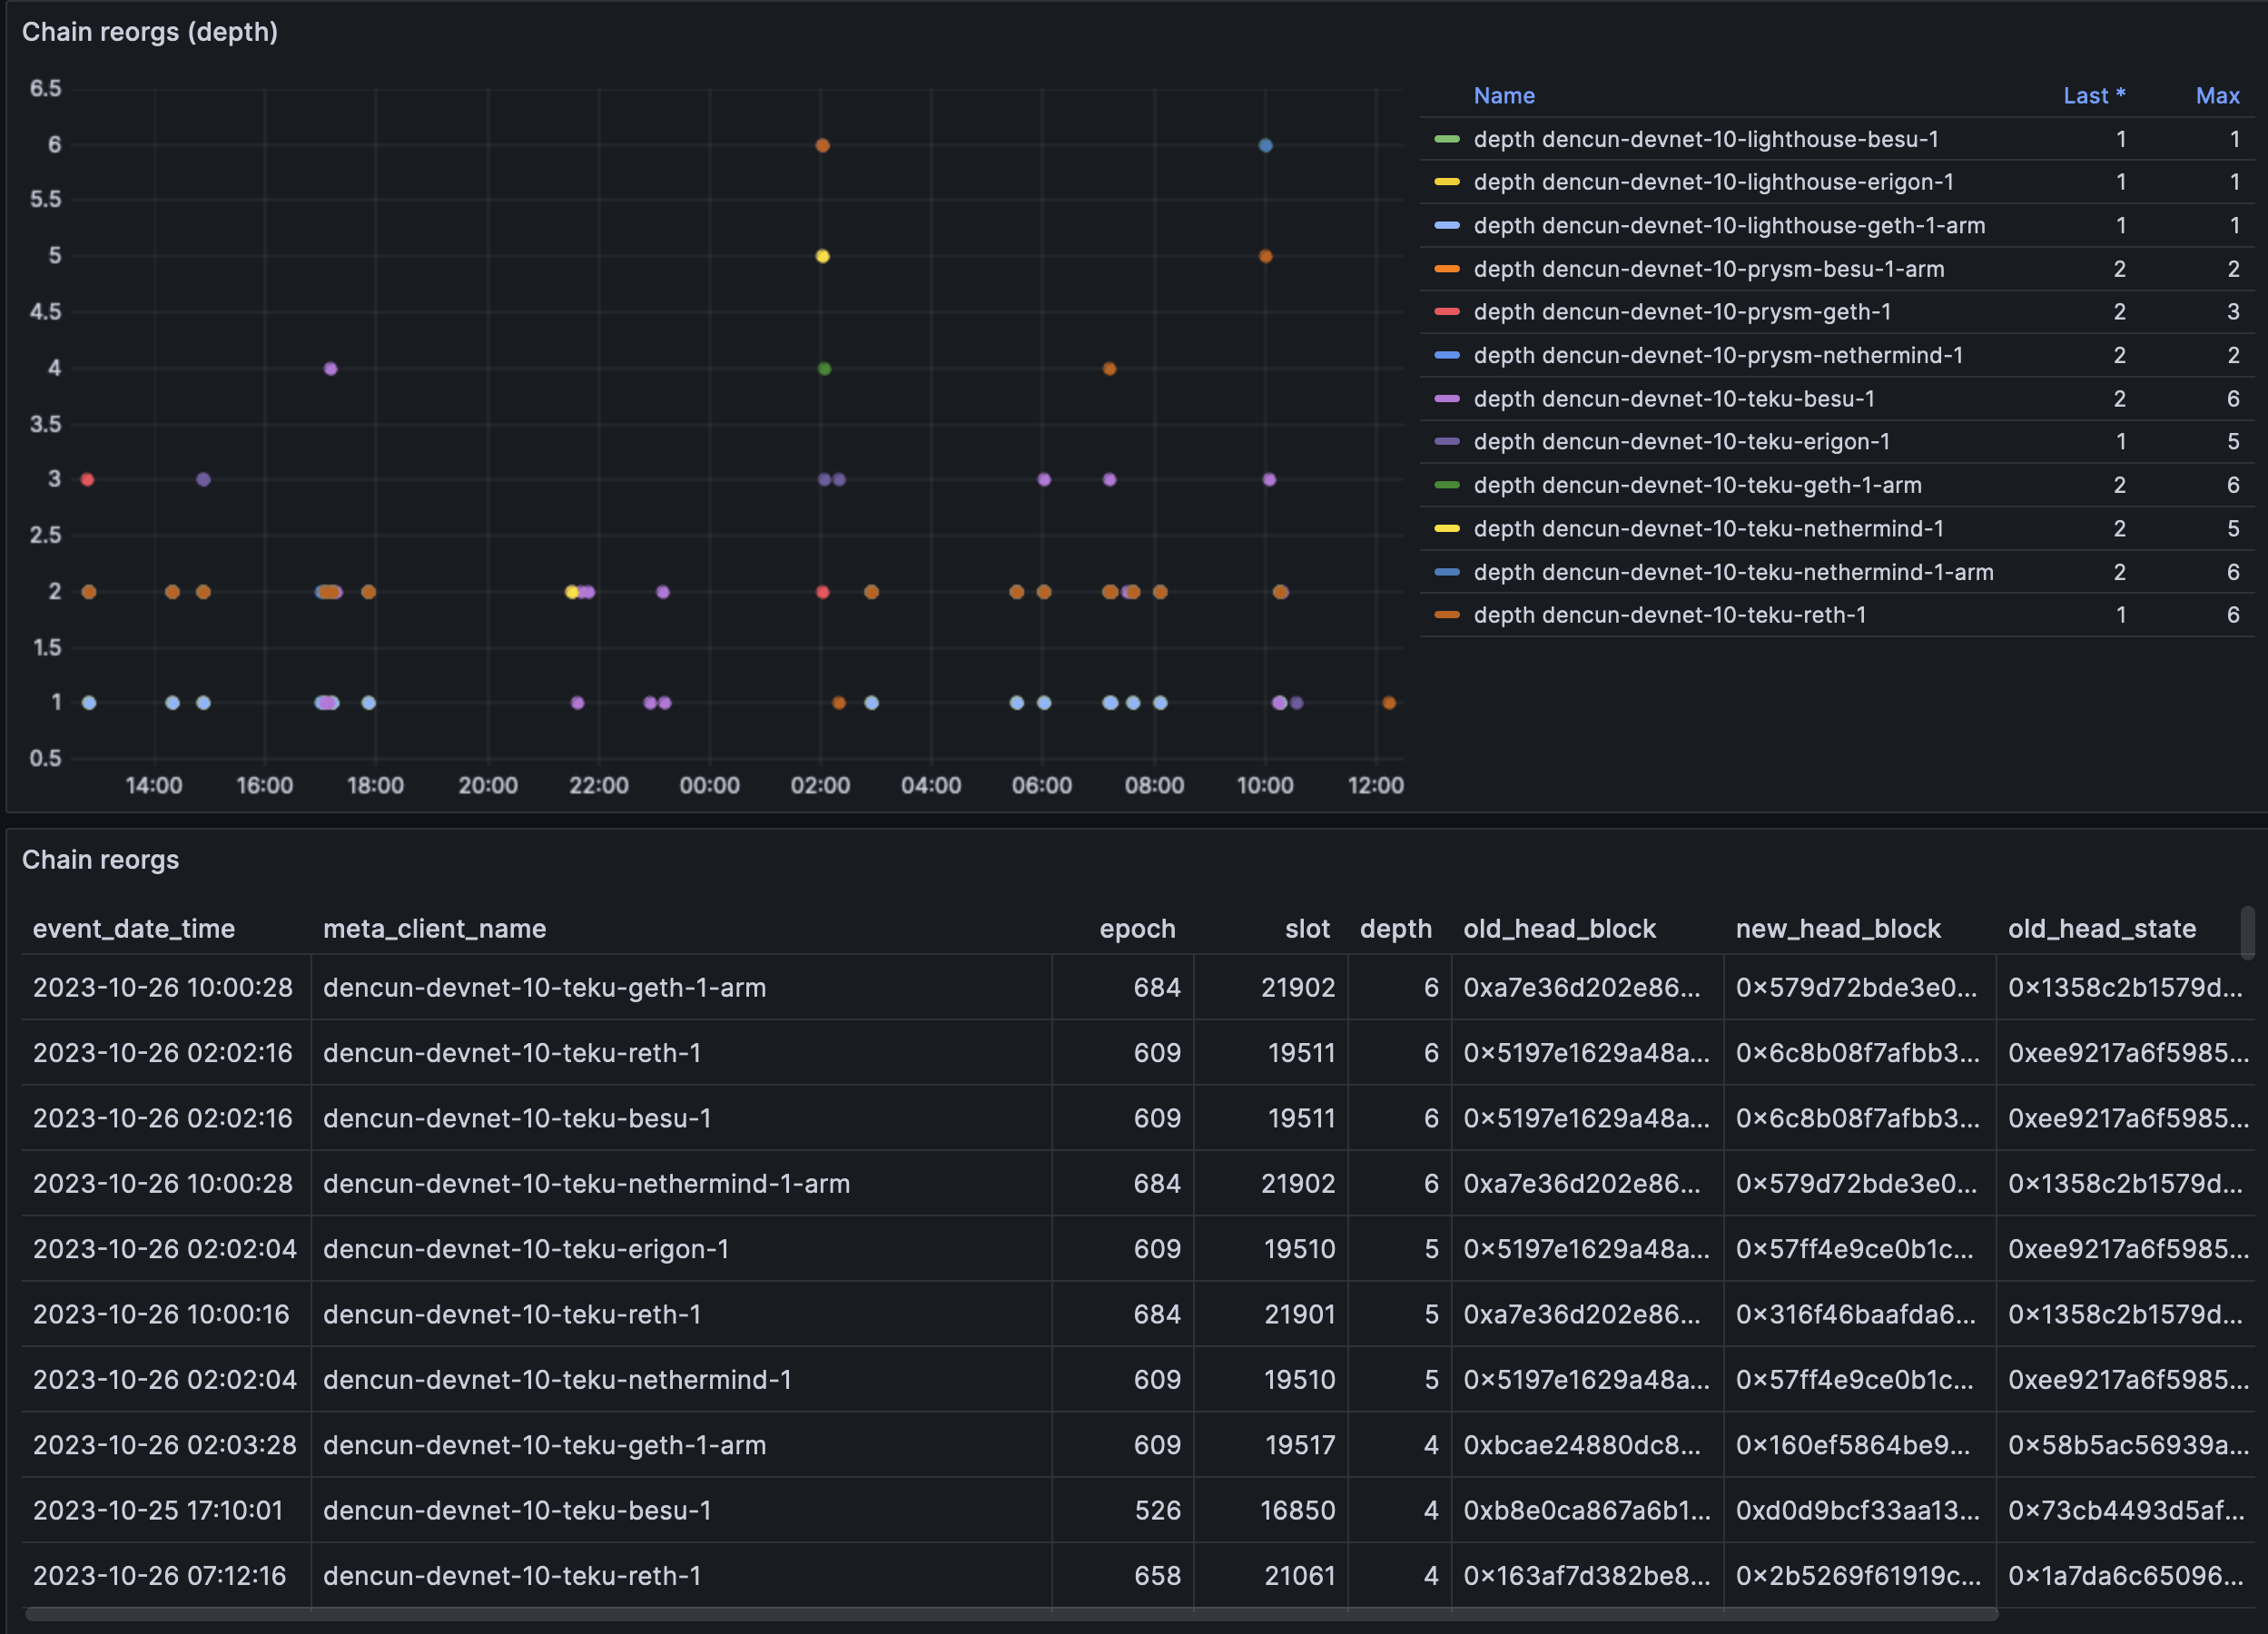
We are seeing an increase in the rate of reorgs, the highest depth seems to be teku nodes.
## Block/Blob performance:
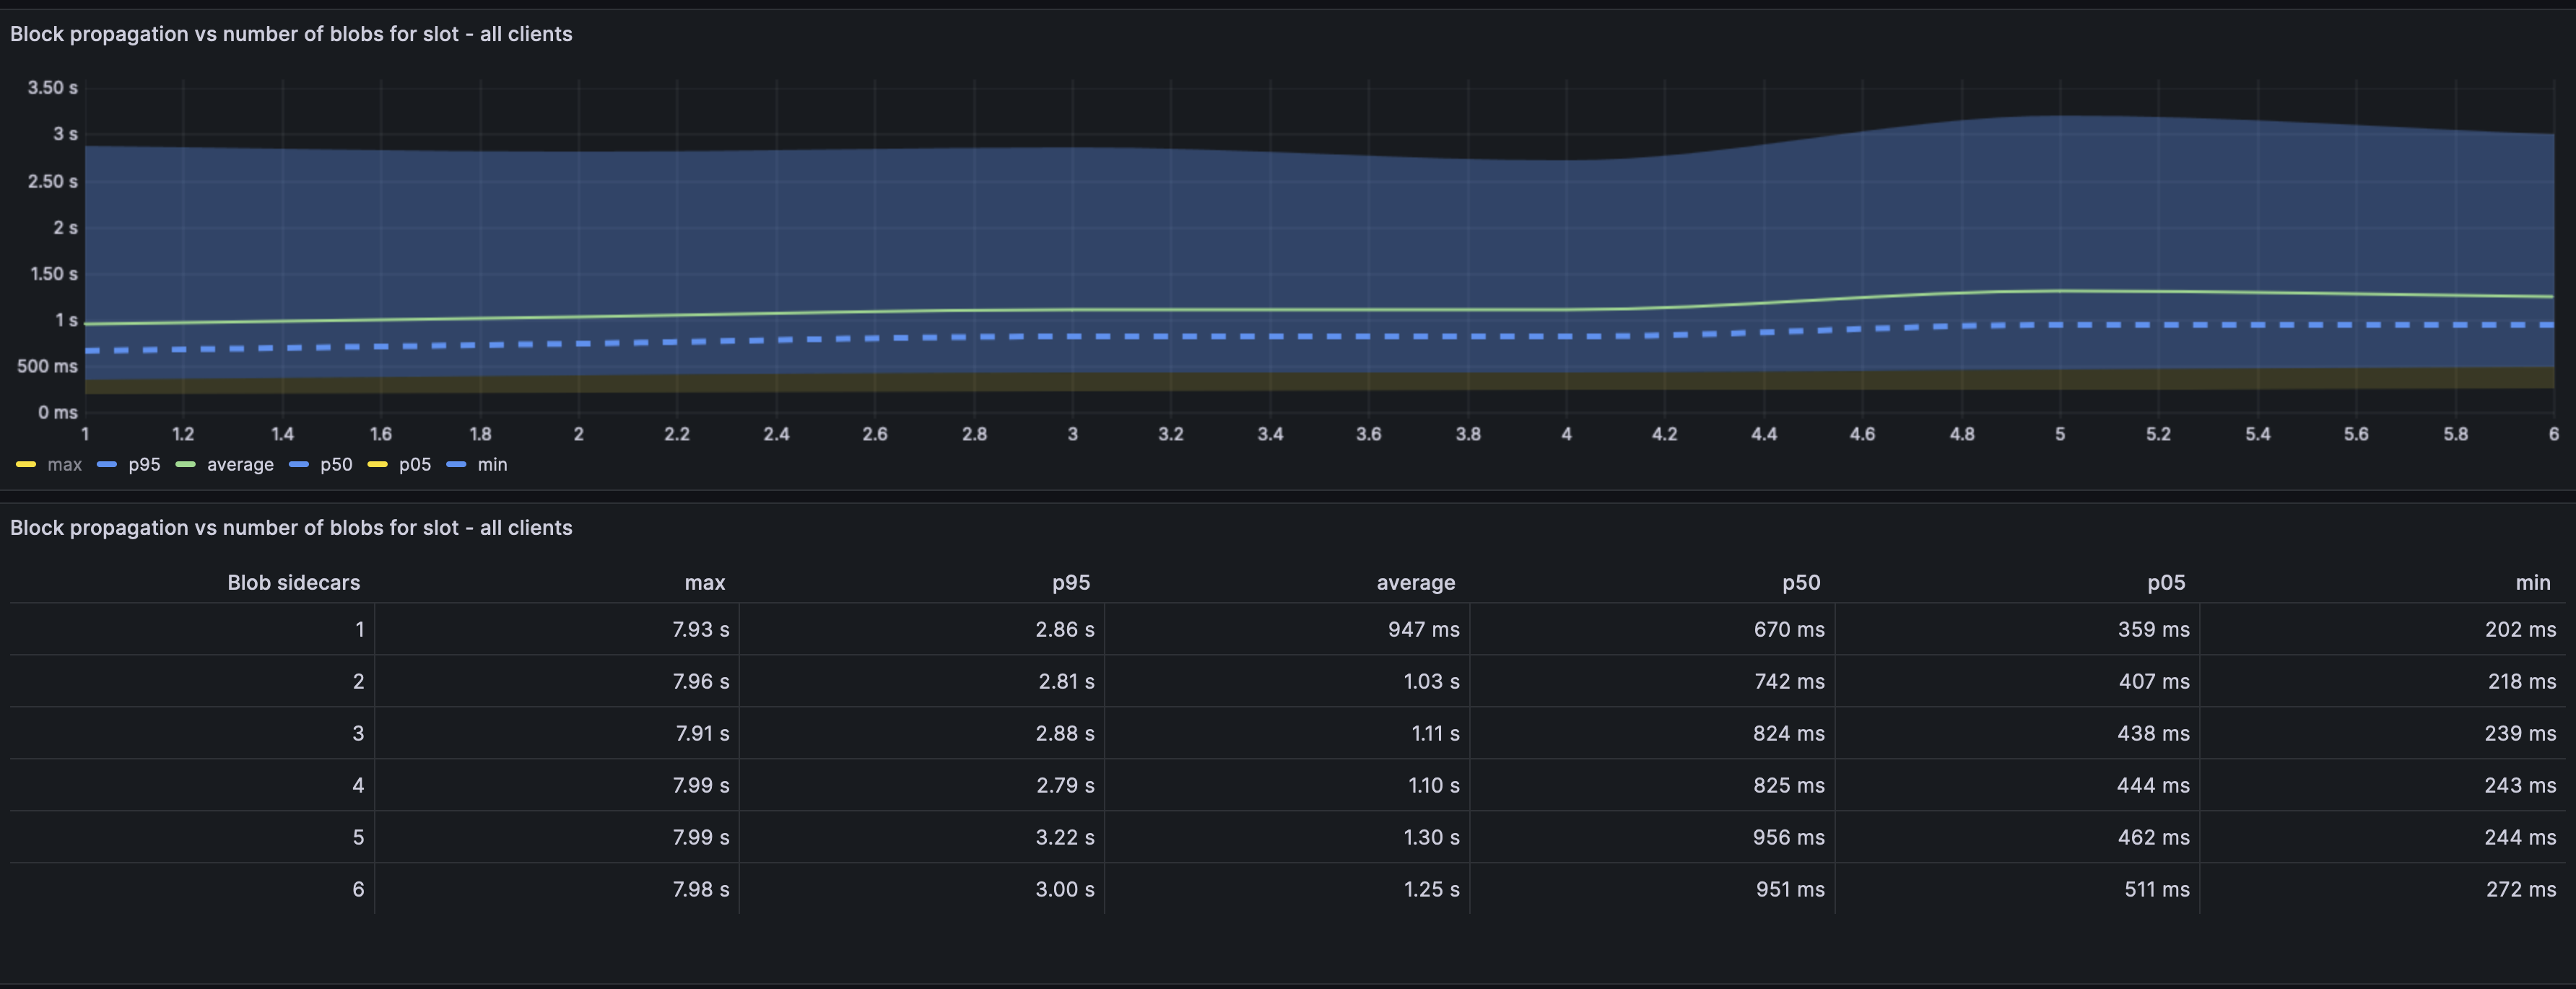
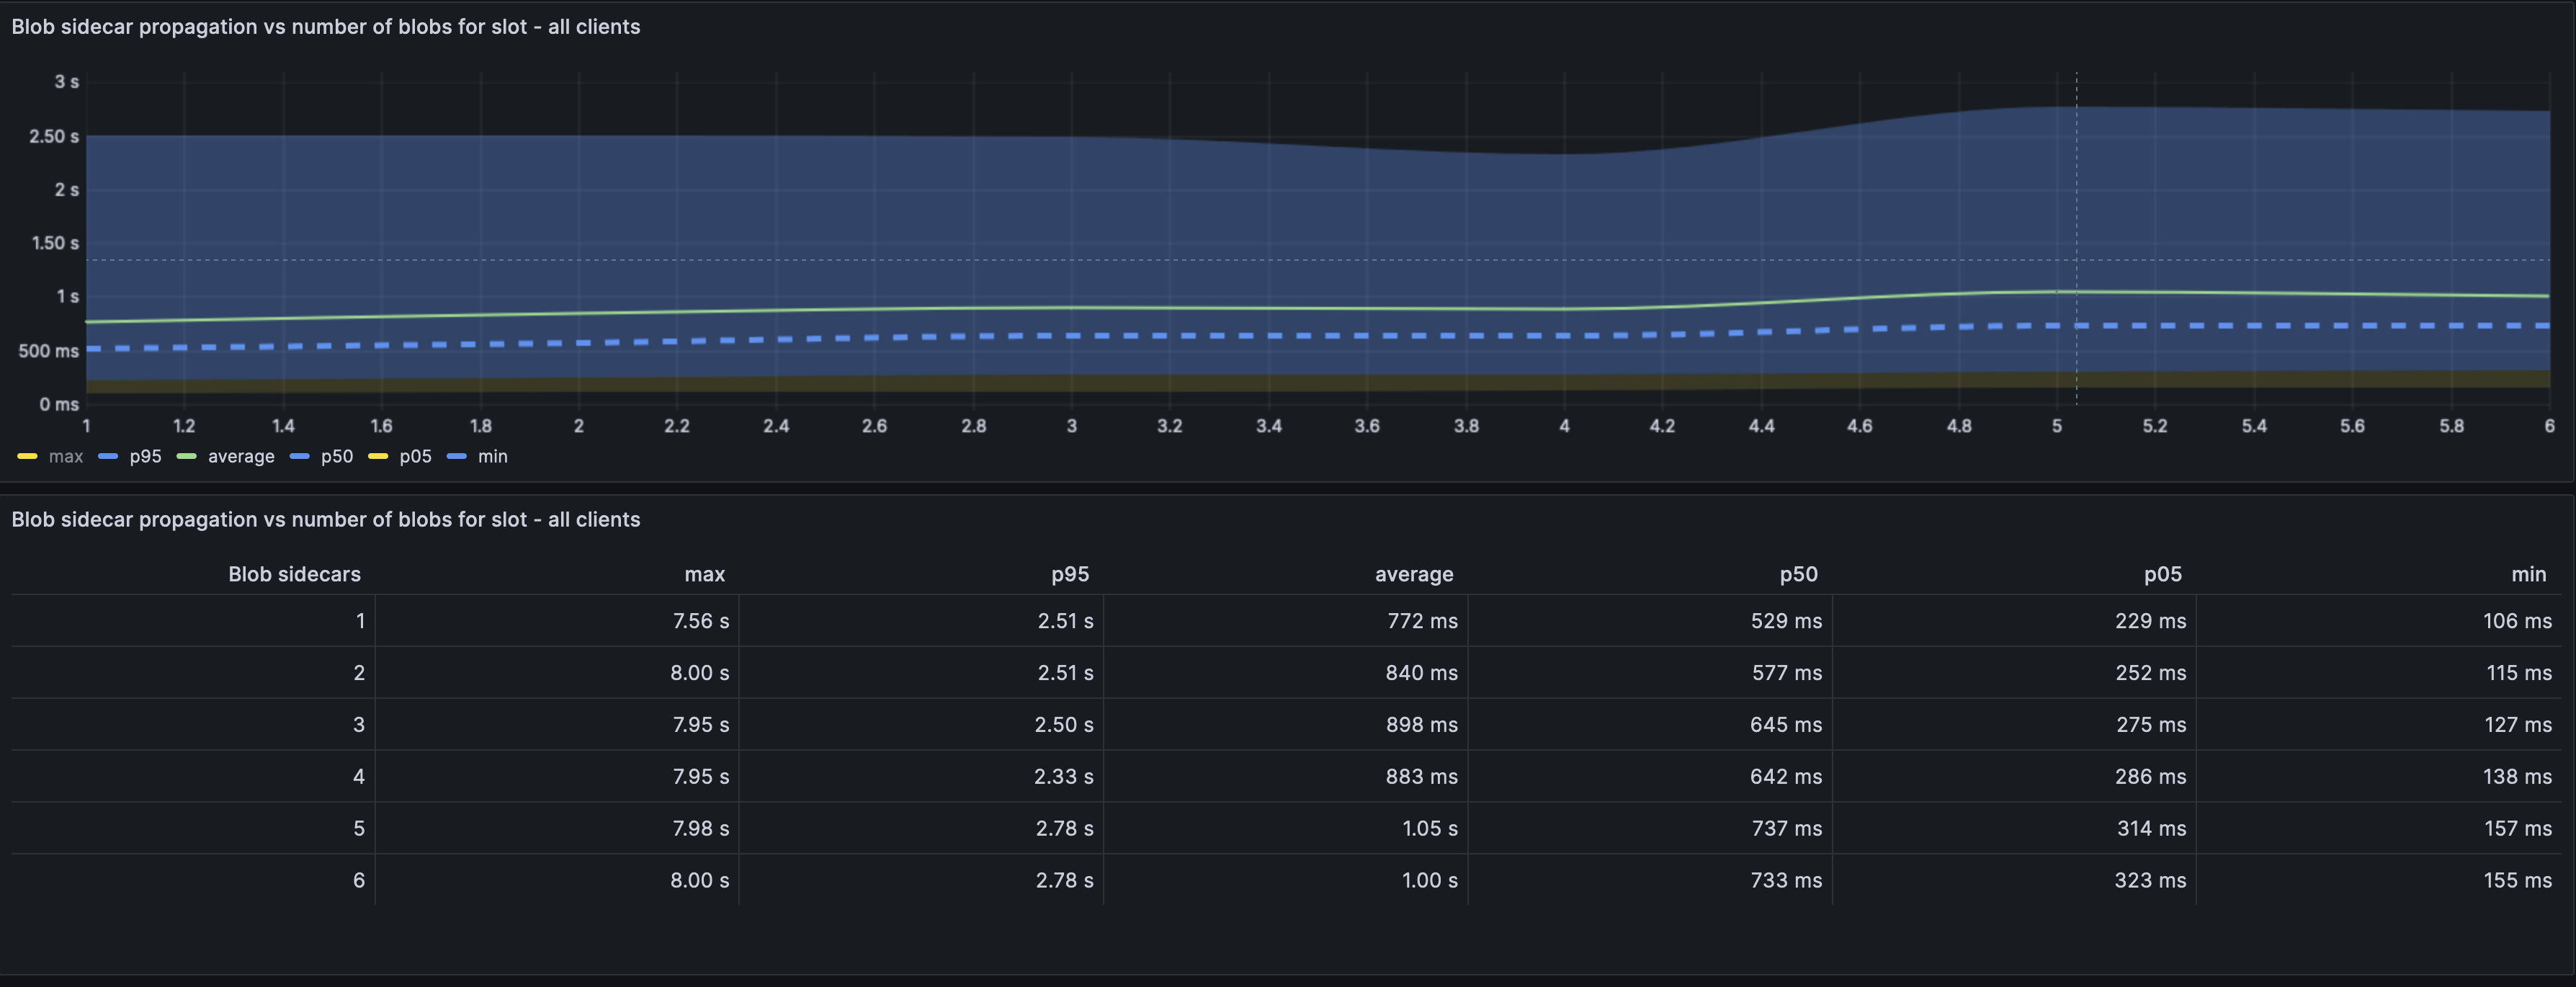
We see here that the block on average doesn't take longer to propagate irrespective of the number of blobs in a slot. This is expected behaviour and by design.
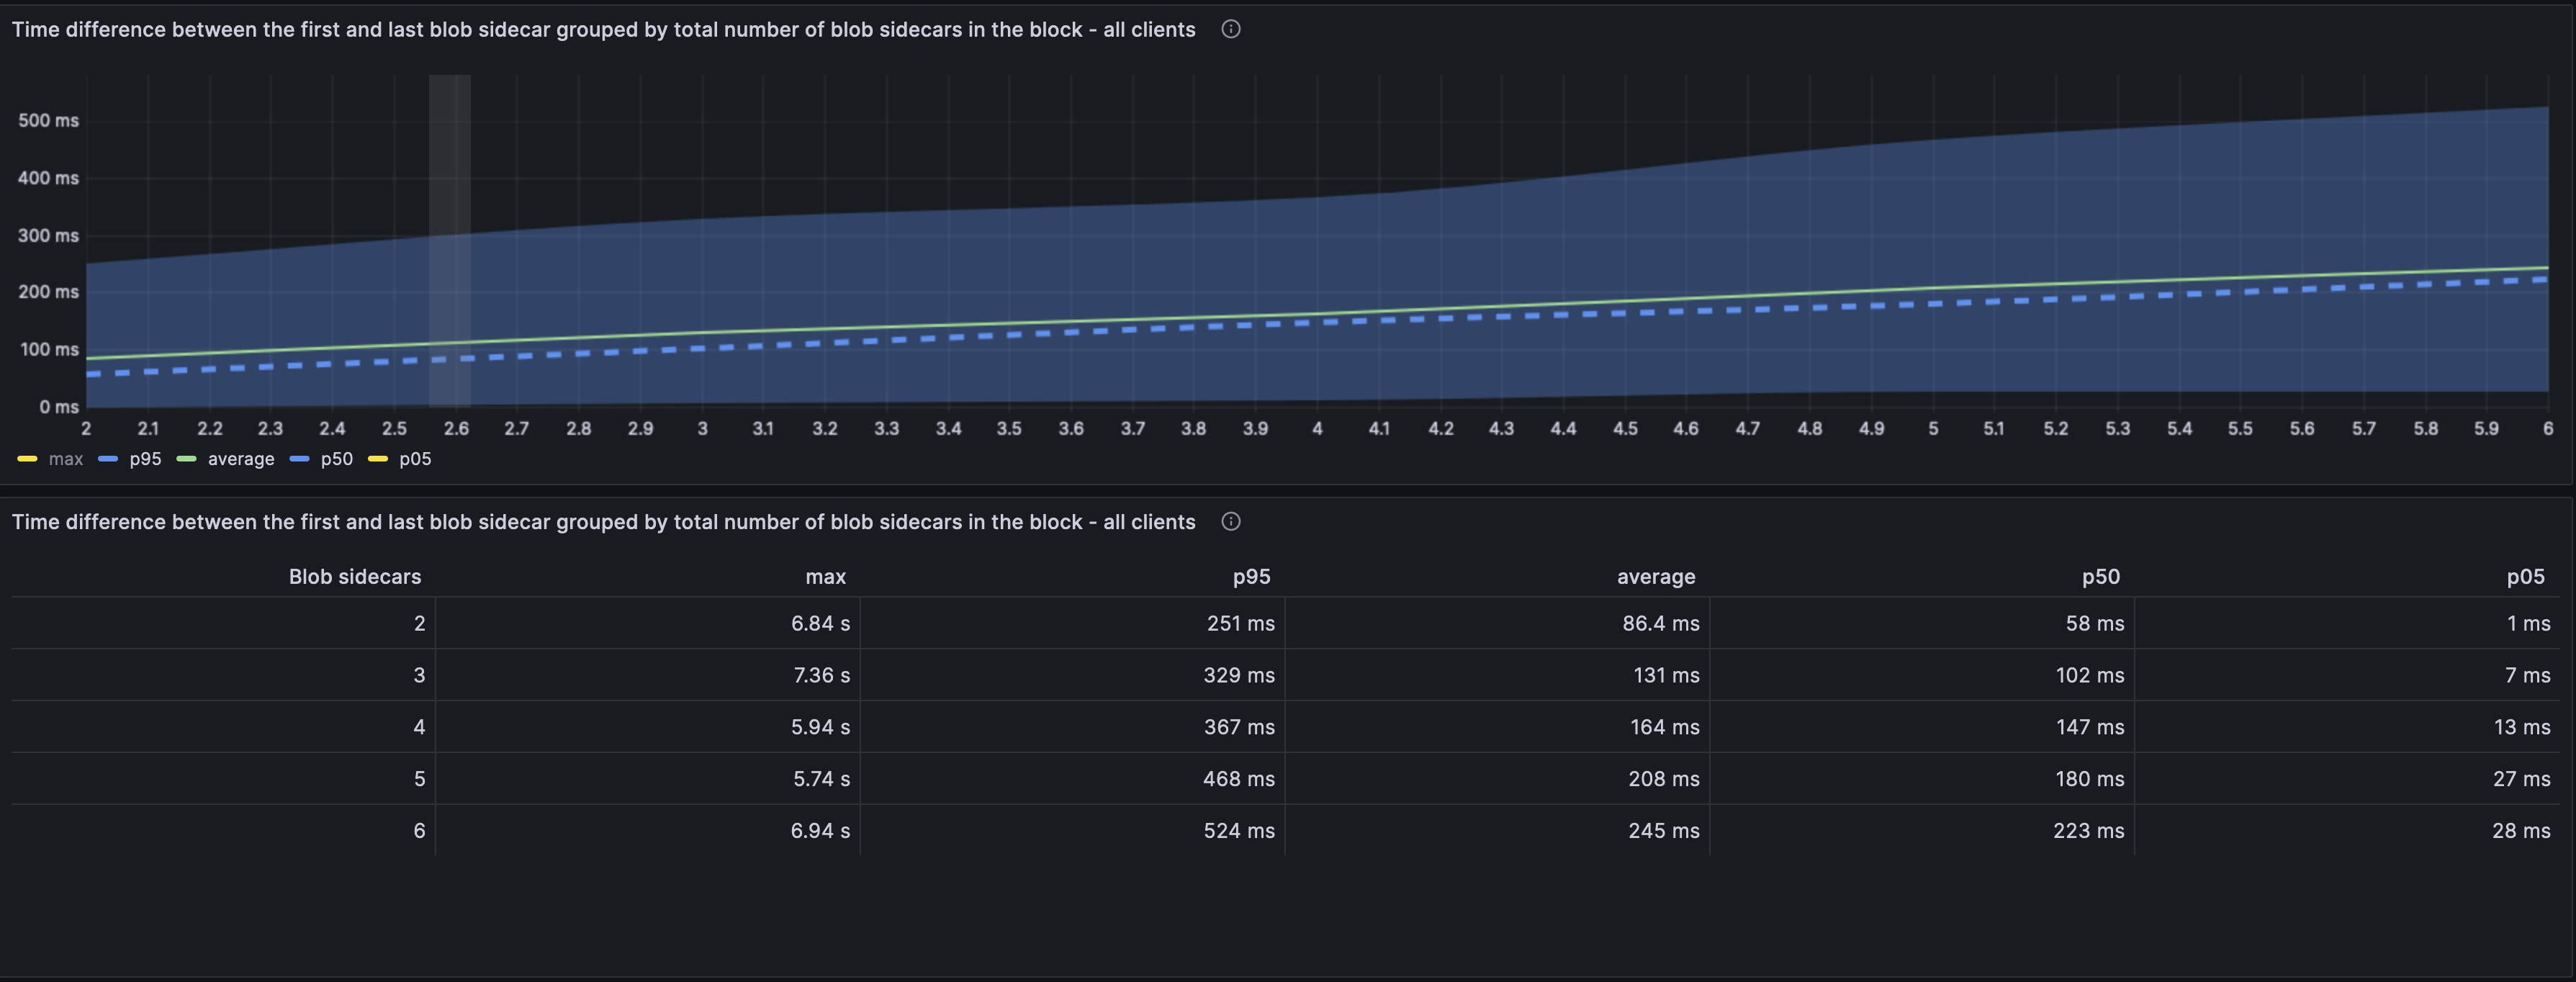
This graph showcases the time taken between the first and last blob of a slot to arrive. The verification cannot start till all the blobs have been received. Compared to the baseline results, we seem to have a marginal increase in time and in some cases the time has reduced. This data probably needs some more analysis and validation as the graph was changed between the two analysis.
## Blob performance per client pair
The individual graphs can be viewed [here](https://grafana.observability.ethpandaops.io/d/be15cc56-e151-4268-8772-f4a9c6a4e246/blobs?orgId=1&from=now-24h&to=now).
However, we ran a manual query with the database of our explorer, dora:
```
graffiti | block_count | with_blobs | blob_rate
-----------------------+-------------+------------+-----------
lodestar/reth | 1 | 1 | 1.00
lighthouse/reth | 32 | 31 | 0.97
teku/nethermind | 1084 | 971 | 0.90
lighthouse/nethermind | 1062 | 960 | 0.90
nimbus/besu | 430 | 387 | 0.90
lighthouse/besu | 427 | 386 | 0.90
lighthouse/geth | 1093 | 979 | 0.90
lodestar/ethereumjs | 20 | 18 | 0.90
teku/geth | 1089 | 965 | 0.89
nimbus/geth | 1095 | 979 | 0.89
prysm/geth | 1032 | 918 | 0.89
lodestar/geth | 738 | 650 | 0.88
lodestar/besu | 399 | 352 | 0.88
prysm/nethermind | 1061 | 932 | 0.88
nimbus/nethermind | 1052 | 922 | 0.88
prysm/besu | 392 | 341 | 0.87
prysm/reth | 14 | 12 | 0.86
teku/besu | 481 | 410 | 0.85
lodestar/erigon | 289 | 230 | 0.80
lighthouse/erigon | 462 | 297 | 0.64
prysm/erigon | 427 | 177 | 0.41
teku/erigon | 452 | 153 | 0.34
nimbus/erigon | 415 | 121 | 0.29
nimbus/ethereumjs | 6 | 1 | 0.17
lighthouse/ethereumjs | 6 | 0 | 0.00
(25 rows)
```
From the data, it looks like erigon might need to add some optimizations. EthereumJS has known performance issues at this scale. Other clients seem to be within margin of error and this is mainly a EL specific metric.
## MEV analysis
```
graffiti | block_count | with_blobs | blob_rate
---------------------+-------------+------------+-----------
lodestar/besu | 1 | 1 | 1.00
lodestar/erigon | 12 | 12 | 1.00
lodestar/ethereumjs | 2 | 2 | 1.00
prysm/besu | 1 | 1 | 1.00
lodestar/geth | 10 | 8 | 0.80
(5 rows)
```
We can see that blobs are now included in mev proposed blocks. This means the basic mev workflow now works with blobs. We will onboard more clients into the mev worflow over the next day.