# Xatu Overview
[Xatu](https://github.com/ethpandaops/xatu) is an Ethereum network monitoring tool created and maintained by the [Ethpandaops](https://github.com/ethpandaops) team. The tool is used heavily by the Ethpandaops team to monitor devnets, testnets and mainnet. Xatu ships as a distributed monolith. This means that a single binary can run in multiple ways (modes). For an overview of Xatu's different modes check the [README](https://github.com/ethpandaops/xatu#modes).
While Xatu itself is only a data capture and pipelining tool, this post will show how the team is using it downstream when combined with [Vector](https://vector.dev/), [Clickhouse](https://clickhouse.com/) and [Grafana](https://grafana.com/).
## EthPandaOps Architecture
The [ethpandaops/analytics-pipeline](https://github.com/ethpandaops/analytics-pipeline) repo contains the configuration for this setup.
```mermaid
graph
subgraph Mainnet, Sepolia, Goerli, Holesky
subgraph 3 Regions
EthereumELp2p((Ethereum EL p2p)) --> XatuMimicry[Xatu Mimicry]
EthereumELp2p --> XatuDiscovery[Xatu Discovery]
BeaconNode[Prysm, Lighthouse, Nimbus, Teku, Lodestar] --> Sentry[5x Xatu Sentry]
end
EthereumBeaconNode[Ethereum Beacon Node] --> XatuCannon[Xatu Cannon]
end
XatuMimicry --> |GRPC| XatuServer((Xatu Server))
XatuDiscovery --> |GRPC| XatuServer
Sentry --> |GRPC| XatuServer
XatuCannon --> |GRPC| XatuServer
XatuServer --> Postgres[(Postgres)]
Postgres --> XatuServer
XatuServer --> |http| Vector1[Vector]
Vector1 --> Kafka
Kafka -->Vector2[Vector]
Vector2 --> Clickhouse[(Clickhouse)]
Kafka --> Vector3[Vector]
Vector3 --> S3
Grafana ---> Clickhouse
style Grafana stroke:red,stroke-width:4px
style XatuServer stroke:red,stroke-width:4px
style Clickhouse stroke:red,stroke-width:4px
```
In this document we'll go over the 3 components that are marked in red.
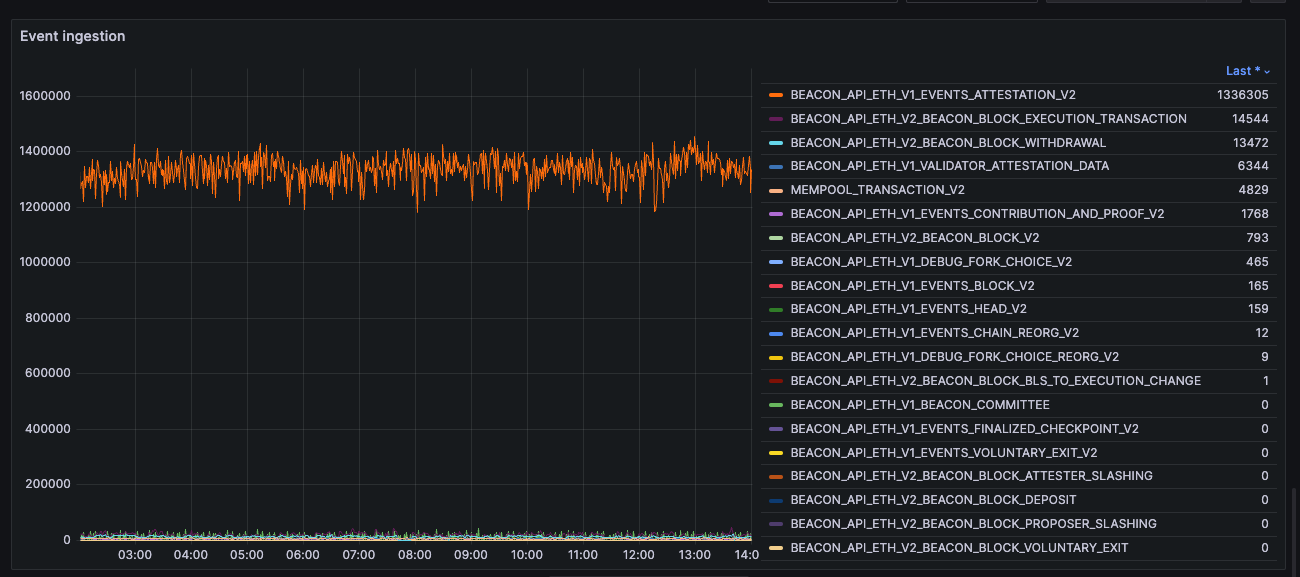
### Xatu Server
`Xatu Server` currently handles around 1.35 million events a minute, with the large majority of those events being attestations from `Xatu Sentry`.
### Clickhouse
#### Cluster configuration
We run a clickhouse cluster that is distributed with 3 shards and 2 replicas per shard. With 6 total nodes, and each node configured as:
```
CPU: AMD EPYC 7502P (32 cores)
Memory: 128GB DDR4 ECC
Disk:
- 8TB NVME (hot)
- 16TB HDD (warm)
- 16TB HDD (cold)
```
This results in a summed storage of:
```
Hot: 6x8TB = 48TB
Warm 6x16TB = 96TB
Cold: 6x16TB = 96TB
```
#### Data
##### Retention
Attestations represent the bulk of our events generated by Xatu, and as such take up the most amount of space. Attestations are moved from Hot -> Warm -> Cold based on the `slot_start_date_time` of the event. We keep mainnet attestations for 40 months, and everything else for 3 months.
We store every other event forever :tada:
```mermaid
graph TD
A(slot_start_date_time) --> B[3 Months: DELETE WHERE meta_network_name != 'mainnet']
B --> C[6 Months old: TO VOLUME 'hdd1']
C --> D[18 Months old: TO VOLUME 'hdd2']
D --> E[40 Months old: DELETE WHERE meta_network_name = 'mainnet']
style A fill:#f9d9b6,stroke:#333,stroke-width:2px
style B fill:#f9b6b6,stroke:#333,stroke-width:2px
style C fill:#b6f9d9,stroke:#333,stroke-width:2px
style D fill:#b6d9f9,stroke:#333,stroke-width:2px
style E fill:#f9b6d9,stroke:#333,stroke-width:2px
```
##### Compression
| Table | Rows | Uncompressed | Compressed |
|:------------------------------------ |:-----------:| ------------ | ---------- |
| beacon_api_eth_v1_events_attestation | 283 Billion | 120.18 TiB | 4.17 TiB |
| beacon_api_eth_v1_beacon_committee | 291 Million | 403.62 GiB | 91.29 GiB |
| mempool_transaction | 593 Million | 184.56 GiB | 40.86 GiB |
| beacon_api_slot | 2.9 Billion | 154.47 GiB | 11.85 GiB |
These are the top 4 heaviest tables in the database, with attestation data going back ~9 months for mainnet.
##### Transformation
We use [dbt](https://dbt.platform.ethpandaops.io) for data transformation in our ELT pipeline.
### Grafana
We use Grafana to visualize and alert on the data created by Xatu. Here's a handful of dashboards that we've created that we think are pretty sweet.
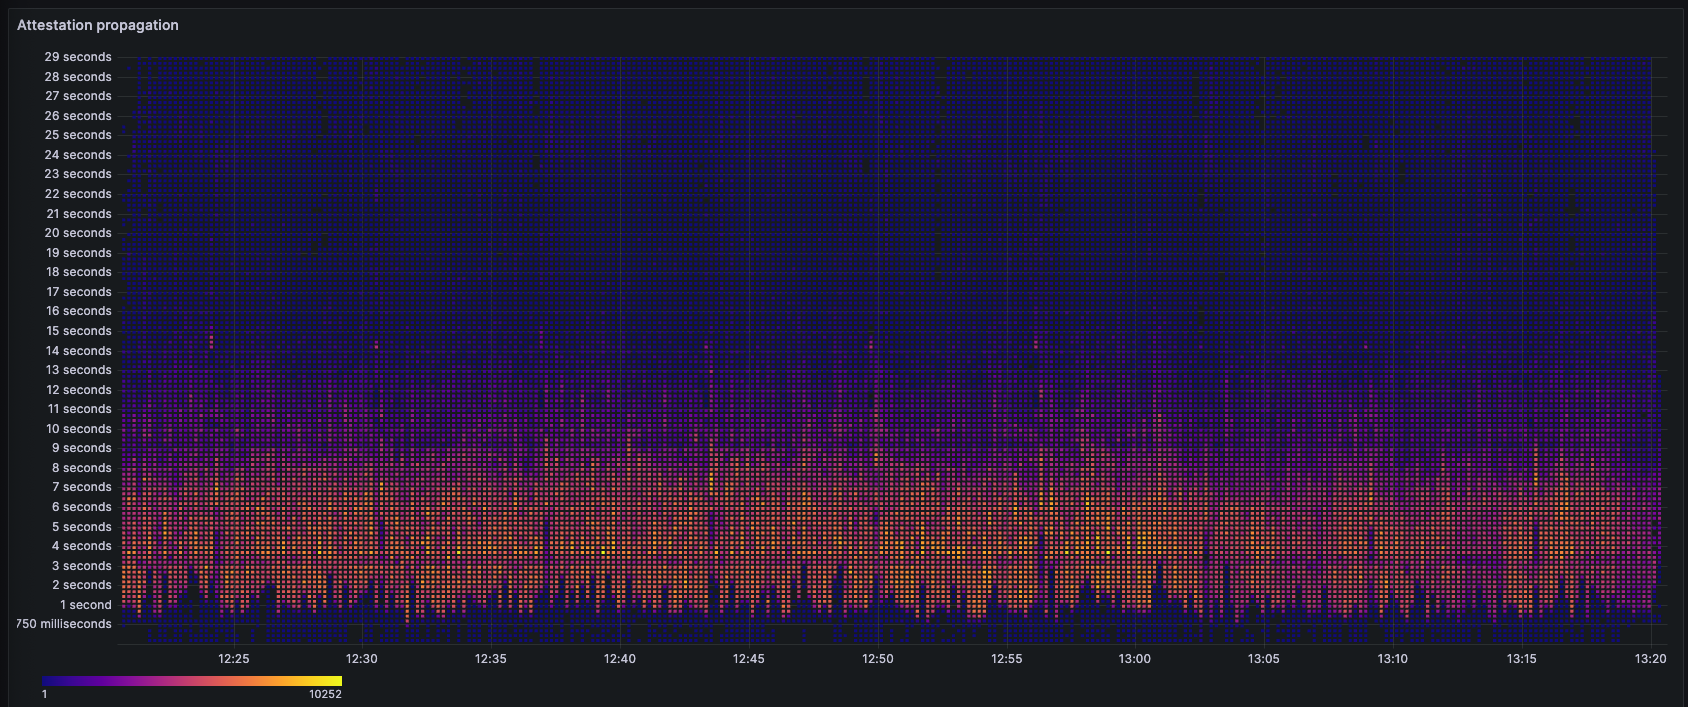
#### Attestation propagation
A heatmap of how far in to the slot an attestation was seen
<details>
<summary>View Query</summary>
<pre>
SELECT
$timeSeries + 12000 as timestamp,
toUInt8(propagation_slot_start_diff / ${heatmap_interval}) * ${heatmap_interval} as diff,
sum(toUInt16(1)) as count
FROM ${attestation_prefix}beacon_api_eth_v1_events_attestation
WHERE $timeFilter
AND meta_client_name IN (${client_name})
AND meta_network_name IN (${network_name})
AND meta_client_geo_continent_code IN (${geo_continent_code})
AND meta_consensus_implementation IN (${consensus_implementation})
AND meta_consensus_version IN (${consensus_version})
AND diff < 30000
GROUP BY
timestamp,
diff
LIMIT 10000000
</pre>
</details>
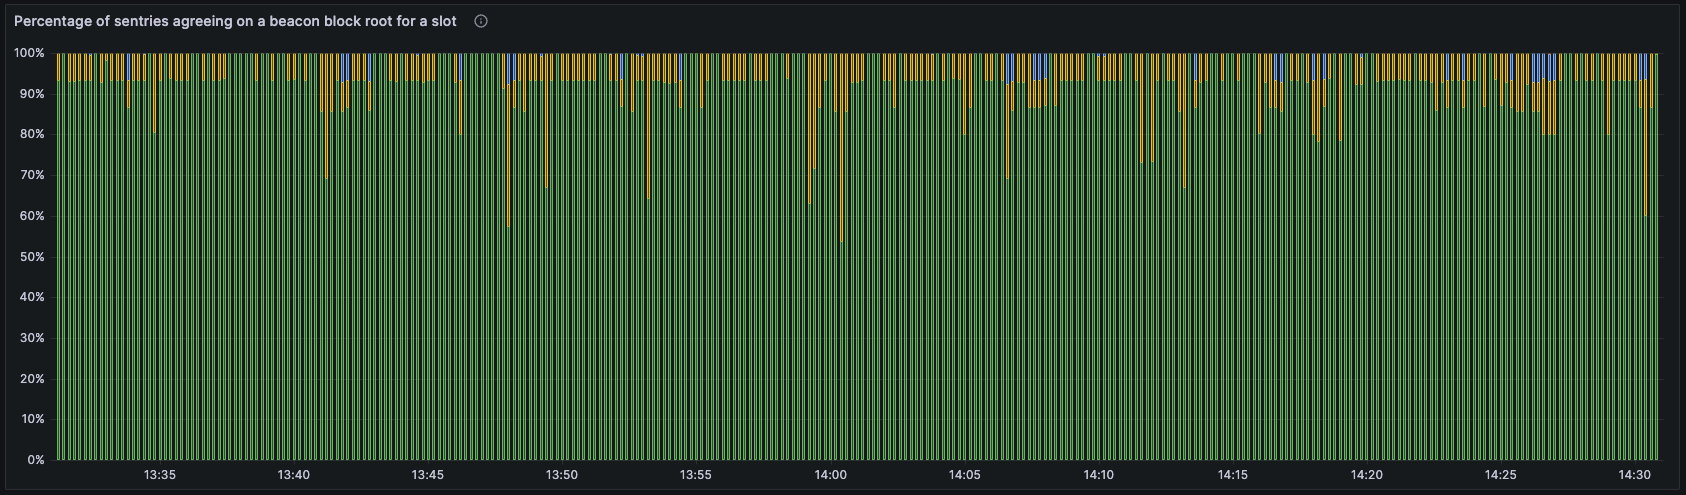
#### Attestation agreement
For a given slot, of all the sentries across all committees, what is the percentage breakdown of every beacon block root.
All green means all sentries across all committees agreed on the same beacon block root. Other colours from green are other beacon block roots that are not in majority.
<details>
<summary>View Query</summary>
<pre>
SELECT
toDateTime(slot_start_date_time) as time,
percent
FROM
(
SELECT
slot_start_date_time,
beacon_block_root,
round((attestation_count / beacon_block_root_total) * 100, 2) AS percent
FROM
(
SELECT
slot_start_date_time,
beacon_block_root,
attestation_count,
sum(attestation_count) OVER (PARTITION BY slot_start_date_time) AS beacon_block_root_total
FROM
(
SELECT
slot_start_date_time,
beacon_block_root,
sum(toUInt32(1)) AS attestation_count
FROM default.${attestation_prefix}beacon_api_eth_v1_validator_attestation_data
WHERE
$__timeFilter(slot_start_date_time)
AND meta_client_name IN (${client_name})
AND meta_network_name IN (${network_name})
AND meta_client_geo_continent_code IN (${geo_continent_code})
AND meta_consensus_implementation IN (${consensus_implementation})
AND meta_consensus_version IN (${consensus_version})
AND committee_index IN (${committee_index})
GROUP BY
slot_start_date_time,
beacon_block_root
ORDER BY attestation_count DESC
)
)
)
ORDER BY time ASC, percent DESC
</pre>
</details>
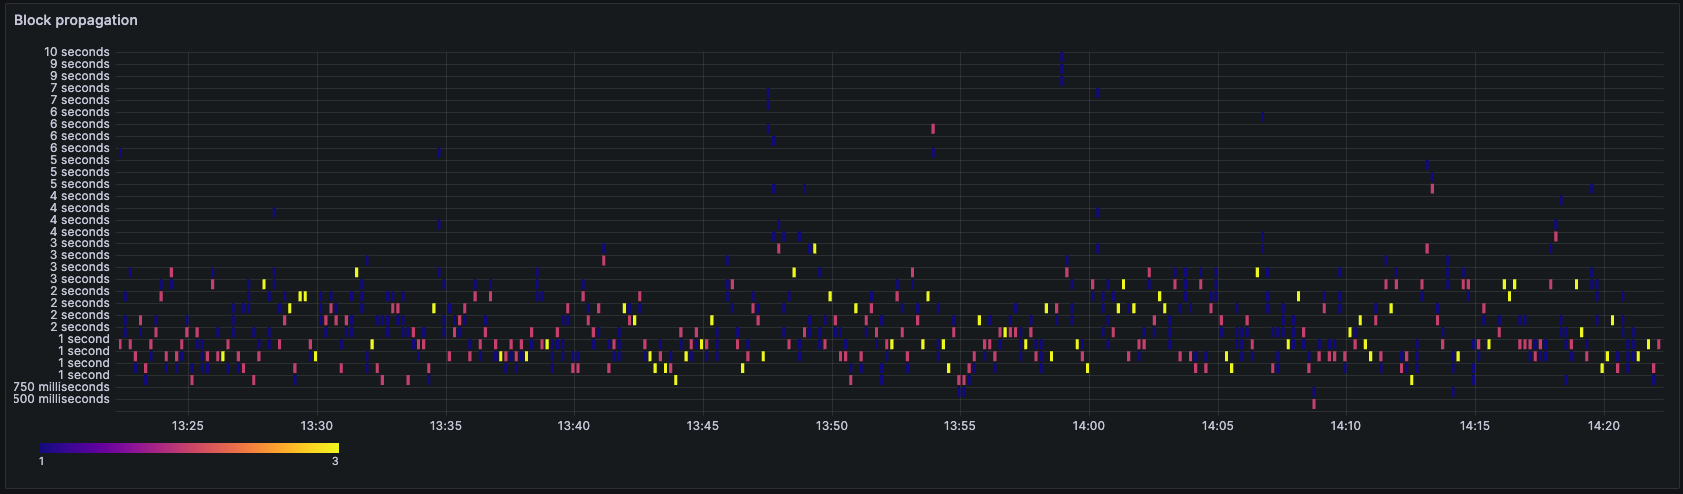
#### Block propagation
A heatmap of the time it took for a block to propagate between sentries
<details>
<summary>View Query</summary>
<pre>
SELECT
$timeSeries + 12000 as timestamp,
multiply(floor(divide(propagation_slot_start_diff, $heatmap_interval)), $heatmap_interval) as diff,
count() as count
FROM default.${table_prefix}beacon_api_eth_v1_events_block
WHERE $timeFilter
AND propagation_slot_start_diff < 100000
AND meta_client_name IN (${client_name})
AND meta_network_name IN (${network_name})
AND meta_client_geo_continent_code IN (${geo_continent_code})
AND meta_consensus_implementation IN (${consensus_implementation})
AND meta_consensus_version IN (${consensus_version})
GROUP BY
timestamp,
diff
</pre>
</details>
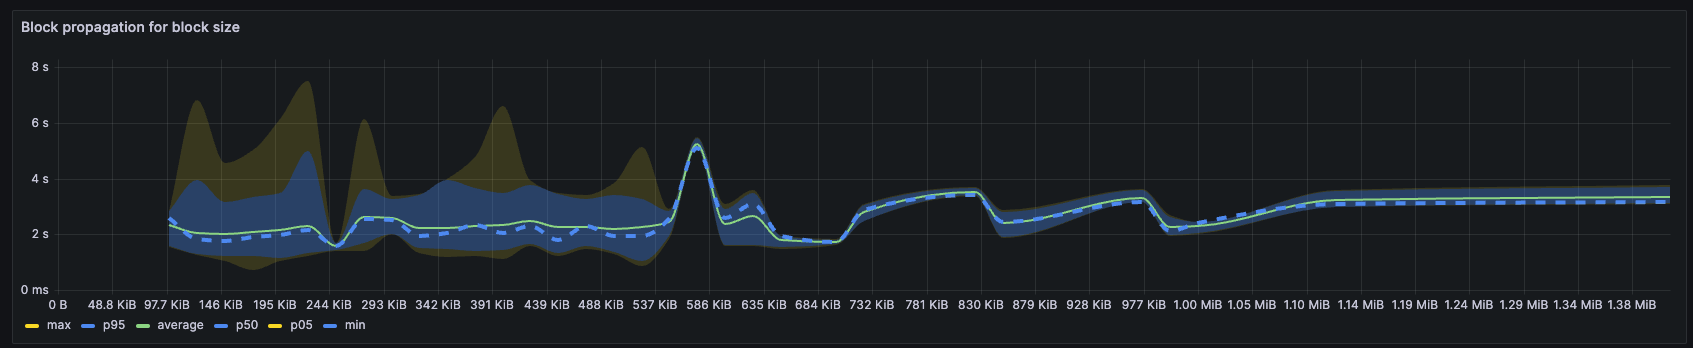
#### Block propagation by size
Average time for different block sizes to propagate between sentries (for mainnet over the last hour)
<details>
<summary>View Query</summary>
<pre>
WITH
filtered_v1 AS (
SELECT block, propagation_slot_start_diff
FROM default.beacon_api_eth_v1_events_block
WHERE slot_start_date_time >= $__fromTime AND slot_start_date_time <= $__toTime
AND propagation_slot_start_diff < 8000
AND meta_client_name IN (${client_name})
AND meta_network_name IN (${network_name})
AND meta_client_geo_continent_code IN (${geo_continent_code})
AND meta_consensus_implementation IN (${consensus_implementation})
AND meta_consensus_version IN (${consensus_version})
),
filtered_v2 AS (
SELECT block_root, floor(block_total_bytes / 25600) * 25600 AS bucketed_bytes
FROM default.beacon_api_eth_v2_beacon_block
WHERE slot_start_date_time >= $__fromTime AND slot_start_date_time <= $__toTime
)
SELECT
max(filtered_v1.propagation_slot_start_diff) max,
quantile(0.95)(filtered_v1.propagation_slot_start_diff) p95,
avg(filtered_v1.propagation_slot_start_diff) average,
quantile(0.50)(filtered_v1.propagation_slot_start_diff) p50,
quantile(0.05)(filtered_v1.propagation_slot_start_diff) p05,
min(filtered_v1.propagation_slot_start_diff) min,
filtered_v2.bucketed_bytes
FROM
filtered_v1
GLOBAL INNER JOIN
filtered_v2
ON
filtered_v1.block = filtered_v2.block_root
GROUP BY
filtered_v2.bucketed_bytes
ORDER BY
filtered_v2.bucketed_bytes ASC;
</pre>
</details>
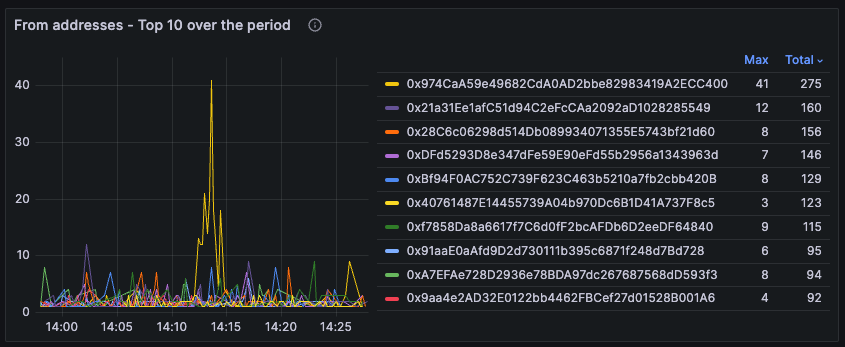
#### Mempool transactions
Top 10 `from` addresses from the last 30mins
<details>
<summary>View Query</summary>
<pre>
WITH TopAddresses AS (
SELECT
`from`,
COUNT(*) as total_transaction_count
FROM default.mempool_transaction
WHERE
$__timeFilter(event_date_time)
AND meta_network_name IN (${network_name})
AND meta_client_geo_continent_code IN (${geo_continent_code})
GROUP BY `from`
ORDER BY total_transaction_count DESC
LIMIT 10
)
SELECT
$__timeInterval(event_date_time) as time,
t.`from`,
COUNT(*) as transaction_count
FROM default.mempool_transaction t
GLOBAL JOIN TopAddresses ta ON t.`from` = ta.`from`
WHERE
$__timeFilter(event_date_time)
AND meta_network_name IN (${network_name})
AND meta_client_geo_continent_code IN (${geo_continent_code})
GROUP BY time, t.`from`
ORDER BY time ASC;
</pre>
</details>