# bigboi-beaconchain-test-1
### Details:
- 2.1M validators total
- 420 nodes
- 16c/32Gb each machine
- 5k keys/node
- {Prysm,Lighthouse}-{Geth,Nethermind} = 1M validators together, equally split
- 28% = prysm, 28% = lighthouse, 14% each - all others
### Overall health:
Epoch 4:
Proposals: 26/32 (81.25%)
Attestations: 801006/2100000 (38.14%)
Source timely: 773796/2100000 (36.85%)
Target correct: 800764/2100000 (38.13%)
Target timely: 800764/2100000 (38.13%)
Head correct: 760119/2100000 (36.20%)
Head timely: 592021/2100000 (28.19%)
Sync committees: 8674/13312 (65.16%)
Epoch 5:
Proposals: 20/32 (62.50%)
Attestations: 656161/2100000 (31.25%)
Source timely: 570979/2100000 (27.19%)
Target correct: 656161/2100000 (31.25%)
Target timely: 656161/2100000 (31.25%)
Head correct: 542192/2100000 (25.82%)
Head timely: 322128/2100000 (15.34%)
Sync committees: 5182/10240 (50.61%)
Epoch 6:
Proposals: 19/32 (59.38%)
Attestations: 758318/2100000 (36.11%)
Source timely: 684940/2100000 (32.62%)
Target correct: 758318/2100000 (36.11%)
Target timely: 758318/2100000 (36.11%)
Head correct: 717456/2100000 (34.16%)
Head timely: 483404/2100000 (23.02%)
Sync committees: 6602/9728 (67.87%)
Epoch 15:
Proposals: 25/32 (78.12%)
Attestations: 866511/2100000 (41.26%)
Source timely: 857032/2100000 (40.81%)
Target correct: 866511/2100000 (41.26%)
Target timely: 866511/2100000 (41.26%)
Head correct: 784420/2100000 (37.35%)
Head timely: 595189/2100000 (28.34%)
Sync committees: 7707/12800 (60.21%)
### Overall Network Report:
- The network was clearly not finalizing. The proposal rate is far higher than attestation rate, indicating issues in block propagation vs time for performing attestations.
- However due to the client distribution deviating from mainnet, we cannot currently deduce how much of the chaos was due to a smaller set of late blocks/missed duties vs actual problems across the board.
- The client distribution was deviating by reducing reliance on lighthouse/prysm (who are ~41% and 33% on mainnet). This means if we were to have a 2.1M validator set on mainnet with the current mainnet client distribution - the network would likely be far healthier. We will be asserting this assumption in a followup testnet.
- Let's first look at per client resource use:
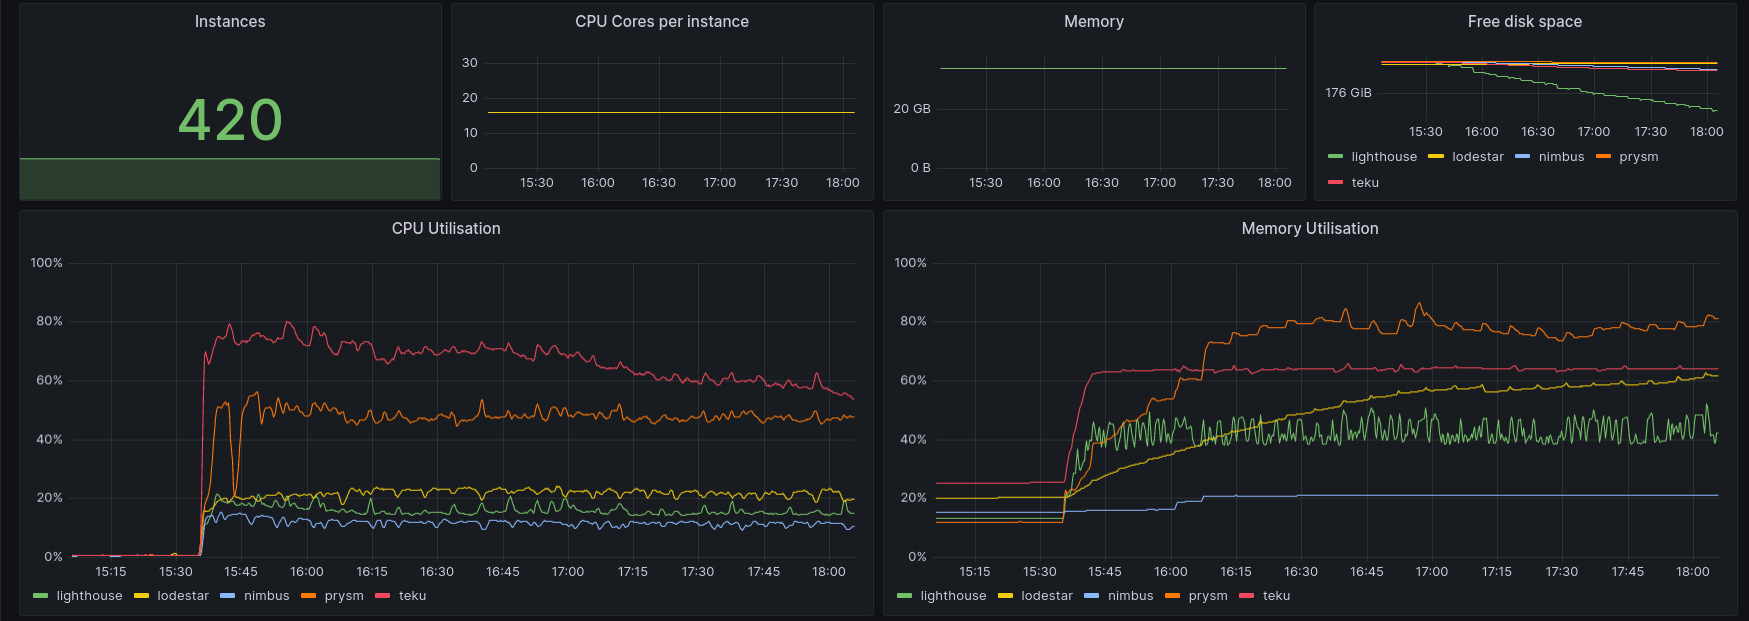
^ The above graphs can give you an overview as to the resource use of the clients. None of the clients have hit 100% use, indicating they have enough resources but are still unable sometimes to perform duties within the expected time frame OR that the nodes have lower than needed instructions per clock (IPC) performance. Scaling beyond the above CPU/RAM wouldn't have much of an effect in the stability of the network, switching to faster clock speeds however might.
- The following graphs were generated using data from Xatu running on 1 instances of each client combination (i.e, 15 total data sources).
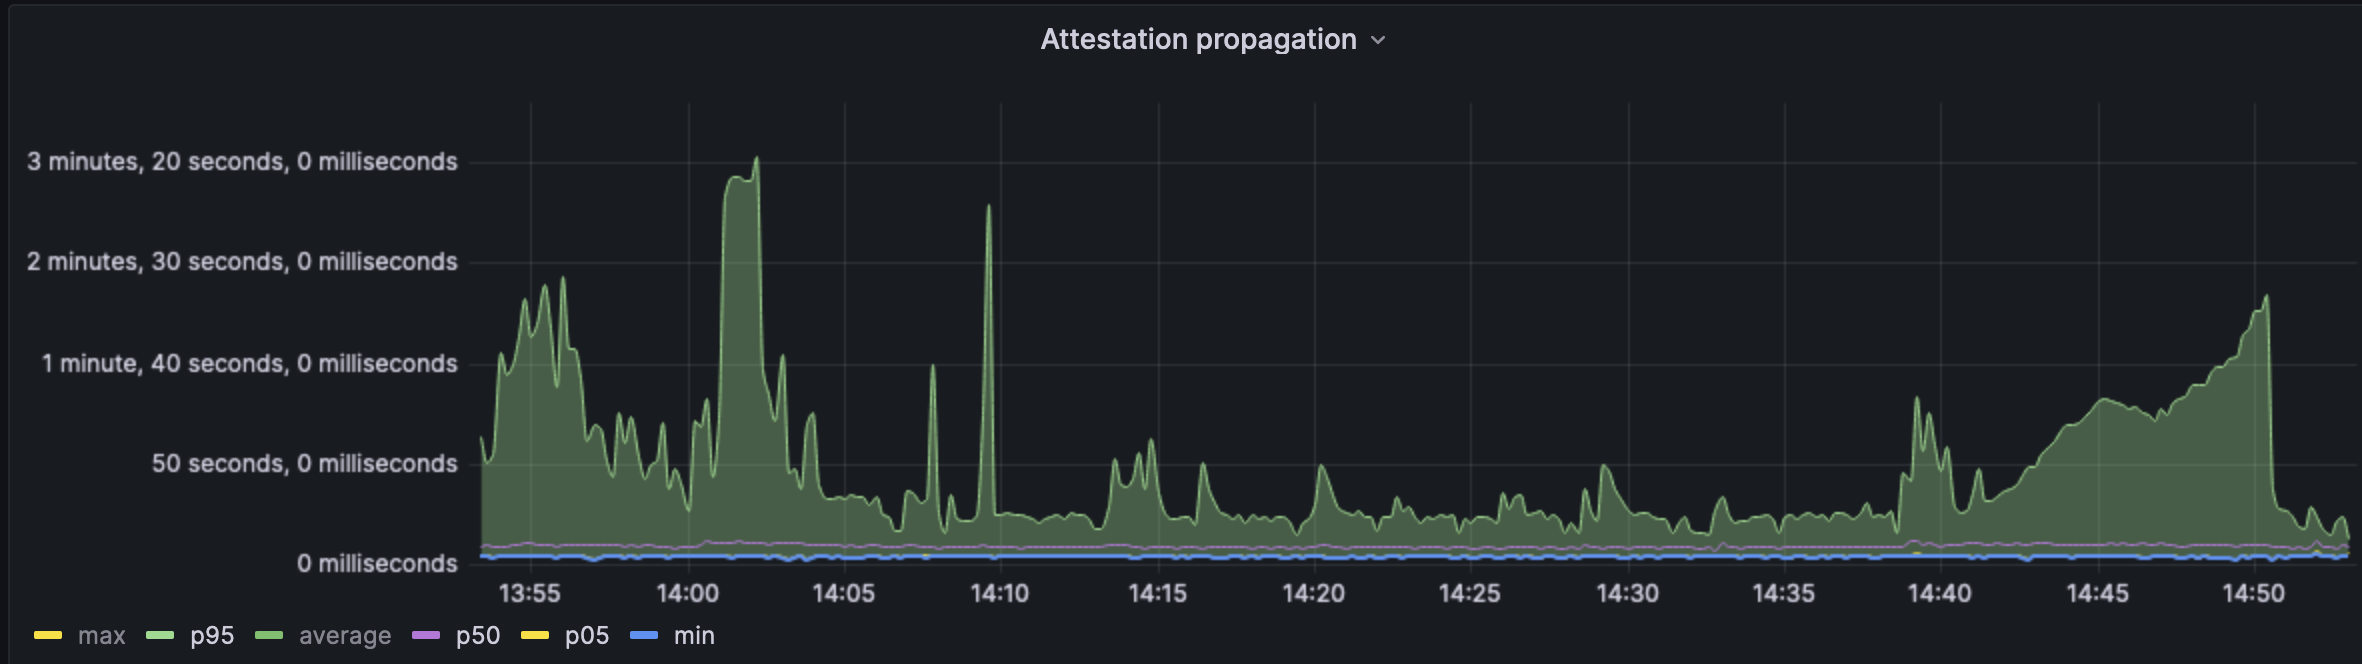
^ attestation propagation between the nodes was fine on average, however the p95 is extremely concerning as it goes well above the slot time of the network and is consistently too slow. This would indicate that not all nodes in the network would have time to process attesations, wrecking havoc on forkchoice. This data however is a bit skewed based on when the attestation shows up on the event stream for Xatu to process, some clients do this before validation and some after - leading to a skew.
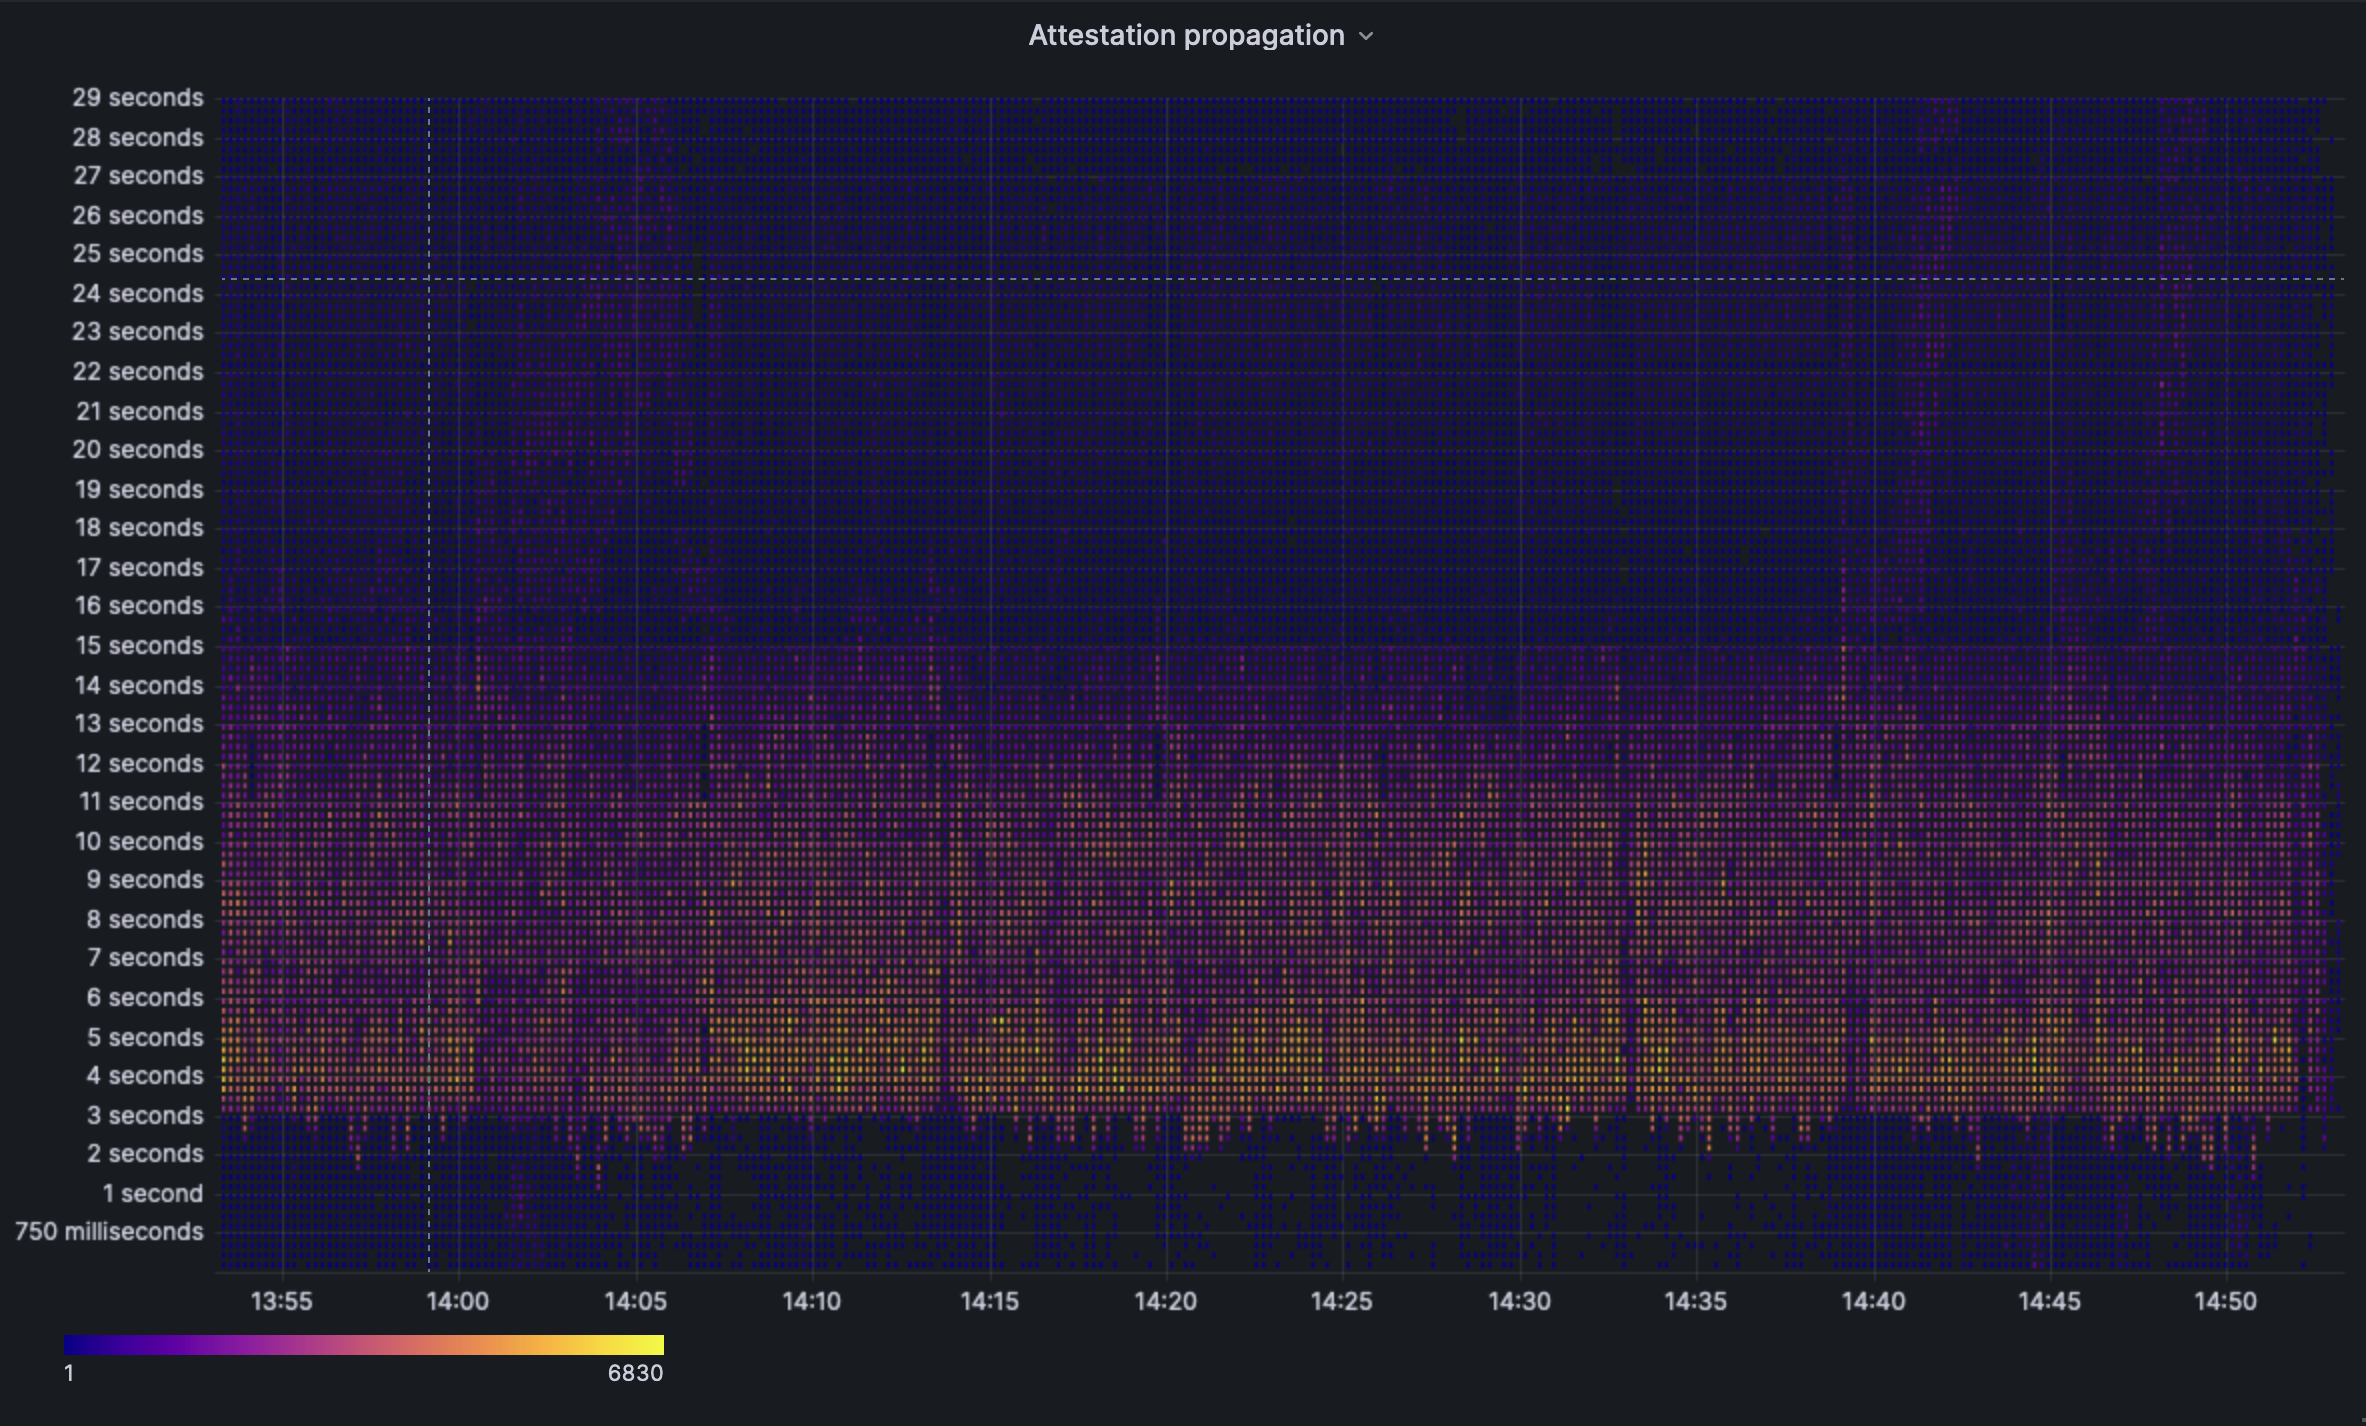
^ The same attestation propagation data, but presented as a heatmap. For a fully healthy network, we'd like to see the heatmap strongest at the 4s mark and almost non-existent post the 10s mark. However you can see the heamap skew more towards the 6s mark and there are some regions of propagation at the >12s mark.
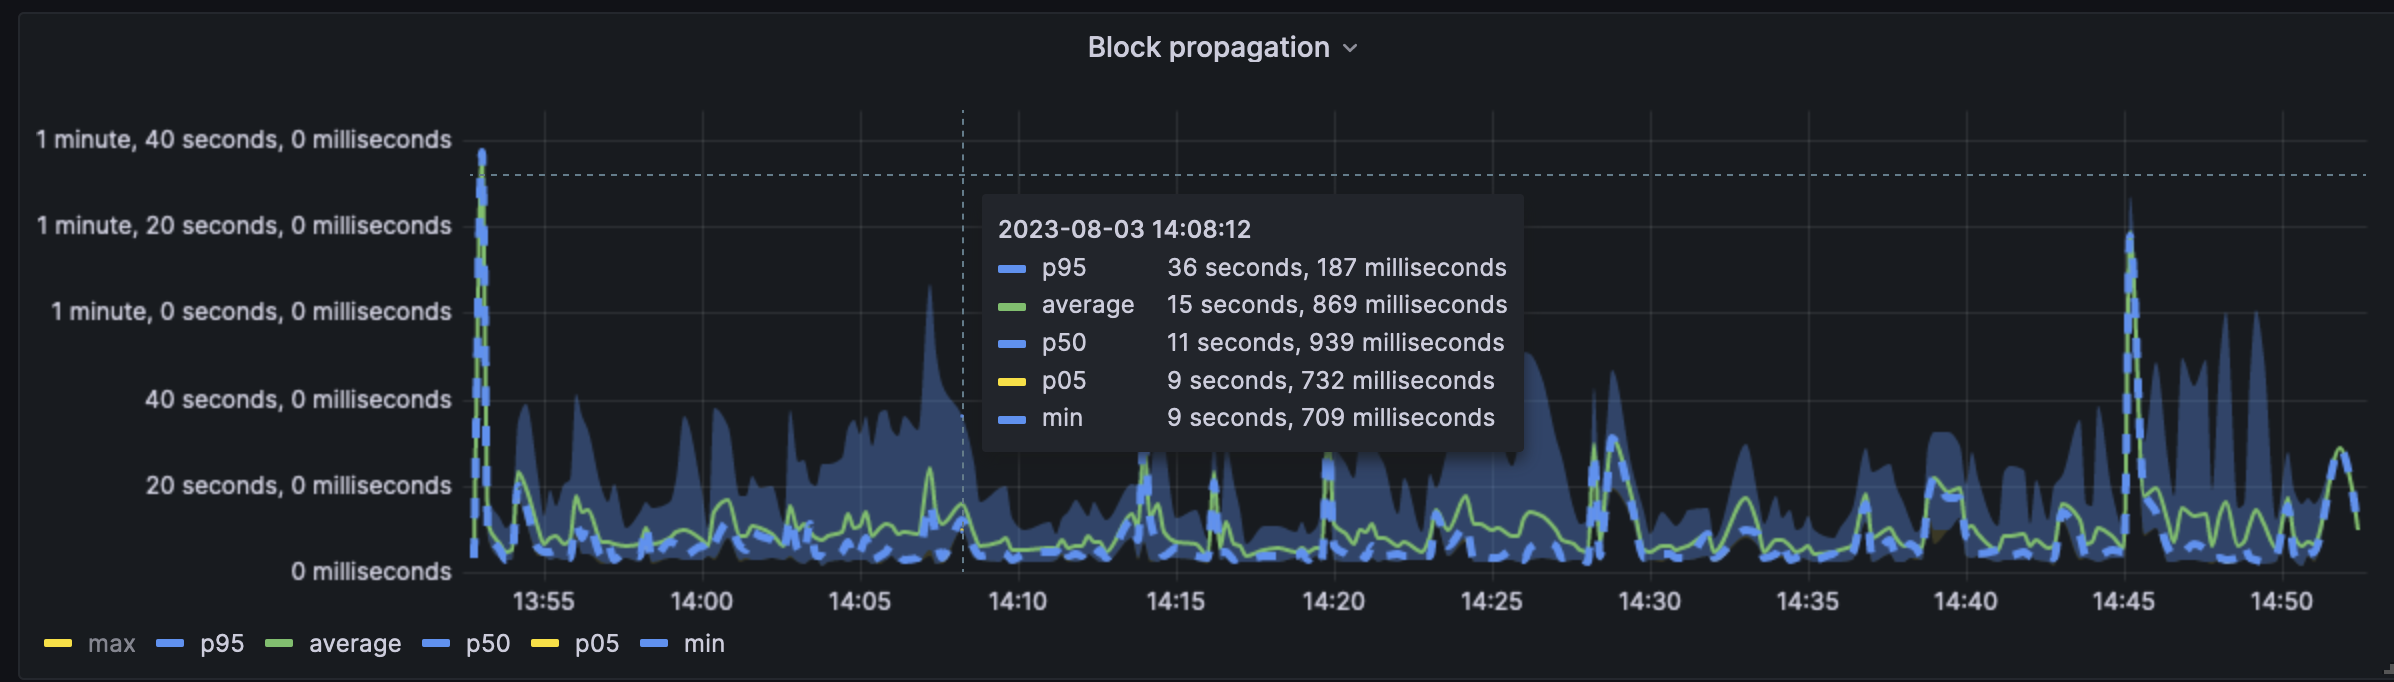
^ Similar to the attestations, we can see the block propagation across nodes. The avarage line is fairly higher than what we see on mainnet. The p95 and max are far higher than we'd like to see in a healthy network. For comparison, on mainnet today we see the p95 never going above 12s (over a 24h timeframe).
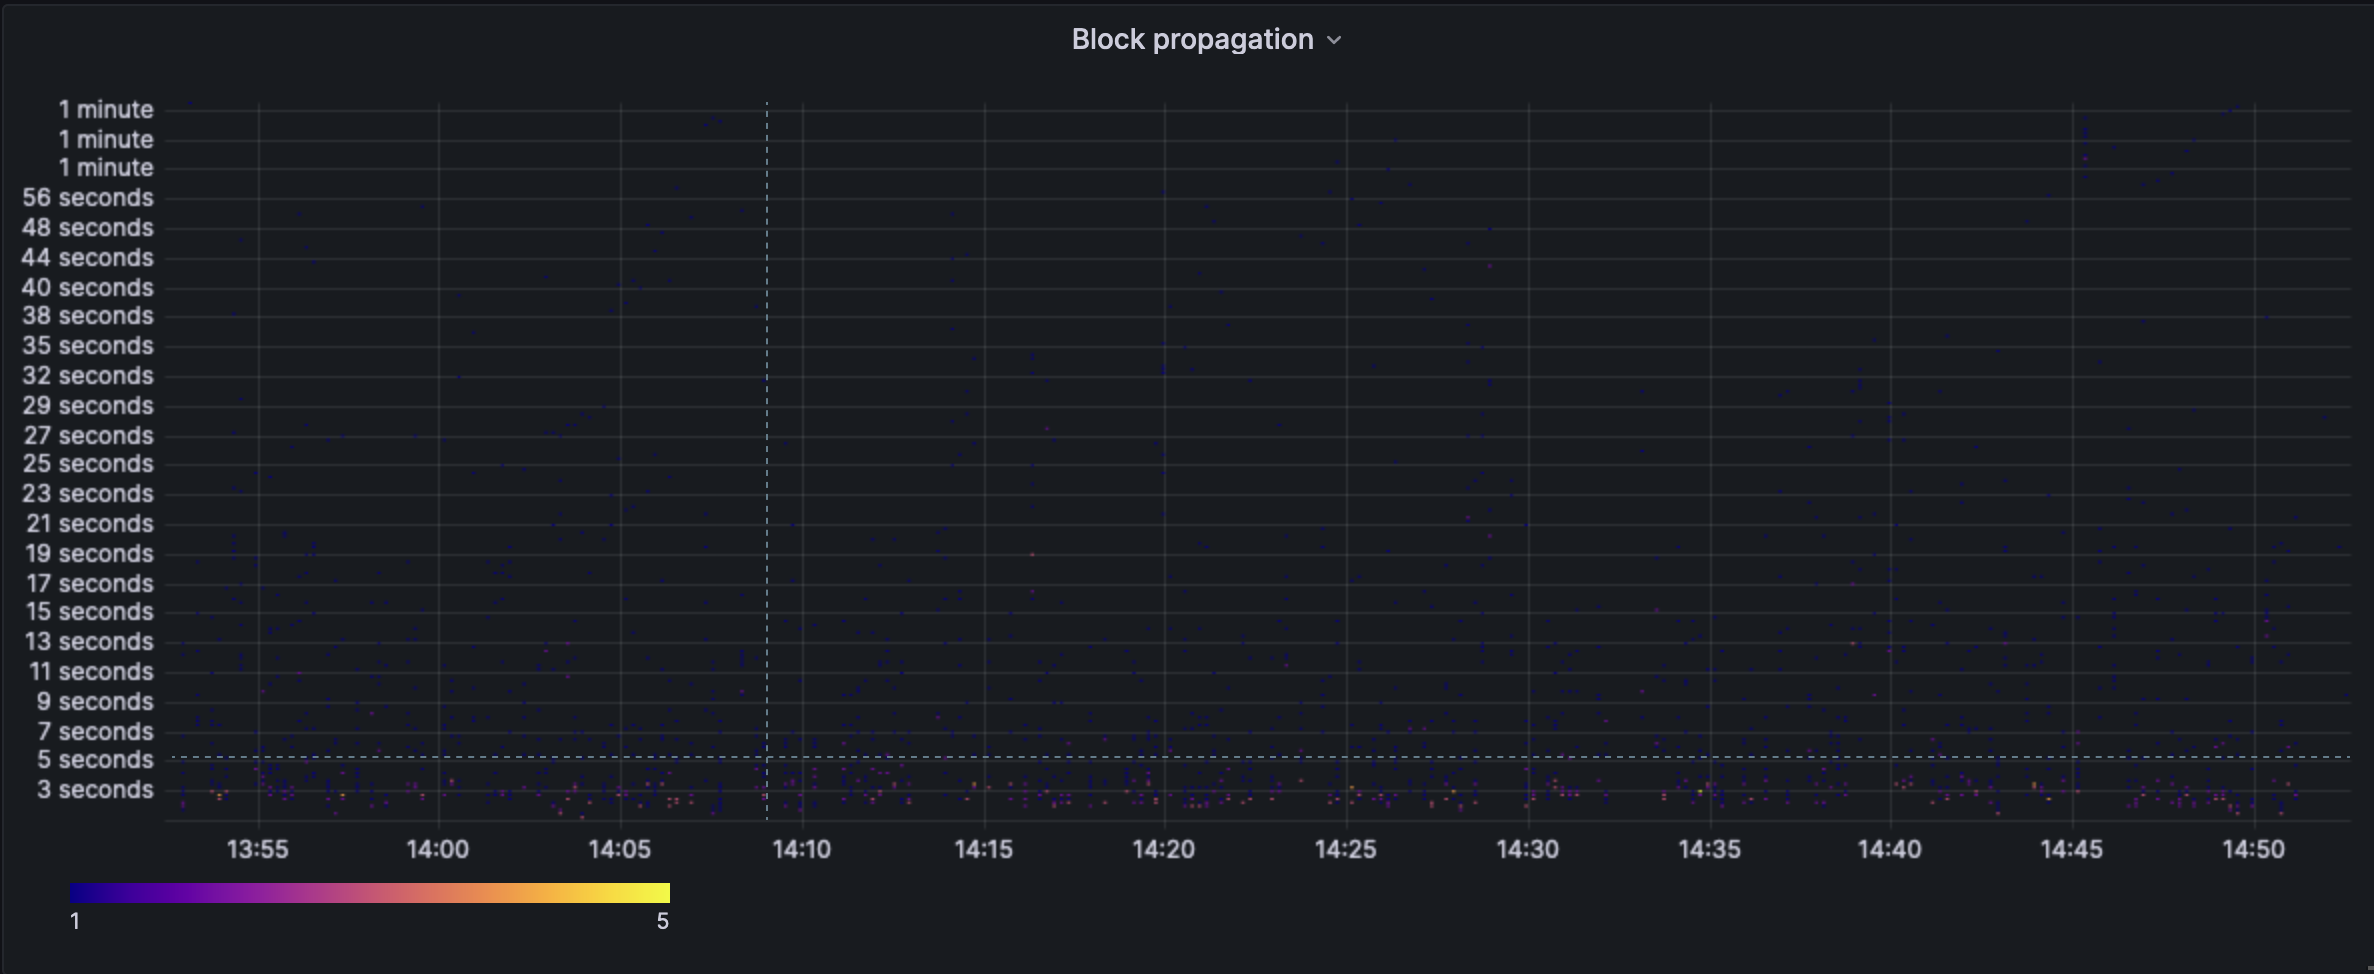
^ The block propagation heatmap indicates that the propagation usually happens between the 3-5s withoutlier far beyond the 20s mark. On mainnet, we see this number hovering around the 750ms-2s mark and almost never going above the 10s mark. This indicates a serious deviation from the current norm.
### Client Specific Reports:
Summary:
We're seeing a relatively healthy number of proposals. Its the late arrival of blocks and the low attestation rate that is hampering the chain performance.
1. Teku:
Teku managed to maintain peers but failed to perform duties in time. At some points its queues were filled and log messages (shown below) were seen, indicating issues with even processing gossip:
```
2023-08-03 15:41:01.714 ERROR - Failed to process received attestation.
java.util.concurrent.CompletionException: java.util.concurrent.RejectedExecutionException: Rejected execution on task queue - forkchoice
```
The teku team ran an async profiler as well as collected logs during the test. Presumbly enough data is collected to figure out what optimizations might be needed.
2. Lighthouse
Seemingly no issues from lighthouse at this scale. The validator seemed to keep up with attestation and proposal duties. Slightly lower proposal rate compared to prysm, could have also been skewed data at the time of collection.
3. Lodestar:
Lodestar massively struggled with epoch transitions, sometimes taking up to 8s for the process. The team collected validator process metrics and will look into potential improvements.
Lodestar's default node heap size limits of ~4GB was also causing the nodes to immediately crash due to hitting limits. It was artificially increased via an Env var, an official release would of course need to be made to make this permanent before we hit this scale of validators.
Some proposals were however seen, though less than expected indicating bottlenecks in proposals.
4. Prysm:
Seemingly no issues from prysm at this scale. The validator seemed to keep up with attestation and proposal duties.
5. Nimbus:
No logs indicating errors. The nimbus node was able to keep up with the chain at this size. However, we did notice an extreme lack of nimbus proposals, we are still unsure of the true reason. There are some logs indicating EL side timeouts, but the node is not under load and doesn't explain the issue fully. It could of course also be p2p related, this issue remains untriaged.