# bigboi-beaconchain-test-2
### Details:
- 2.1M validators total
- 420 nodes
- 16c/32Gb each machine
- 5k keys/node
- Prysm 43%, lighthouse 33.5%, teku 17.5%, nimbus 5% and lodestar 1%
### Overall health:
Epoch 3:
Proposals: 25/32 (78.12%)
Attestations: 928136/2100000 (44.20%)
Source timely: 867459/2100000 (41.31%)
Target correct: 928136/2100000 (44.20%)
Target timely: 928136/2100000 (44.20%)
Head correct: 897751/2100000 (42.75%)
Head timely: 714156/2100000 (34.01%)
Sync committees: 10148/12800 (79.28%)
### Overall Network Report:
- The network is clearly not finalizing. The proposal rates are extremely healthy at ~80% range(compared to attestations). The attestations however aren't, indicating an issue in performing attestation duties in time or attestation propagation issues.
- Overall, the mainnet distribution is more consistent and performant compared to the more equal distribution.
- Per client resource use:
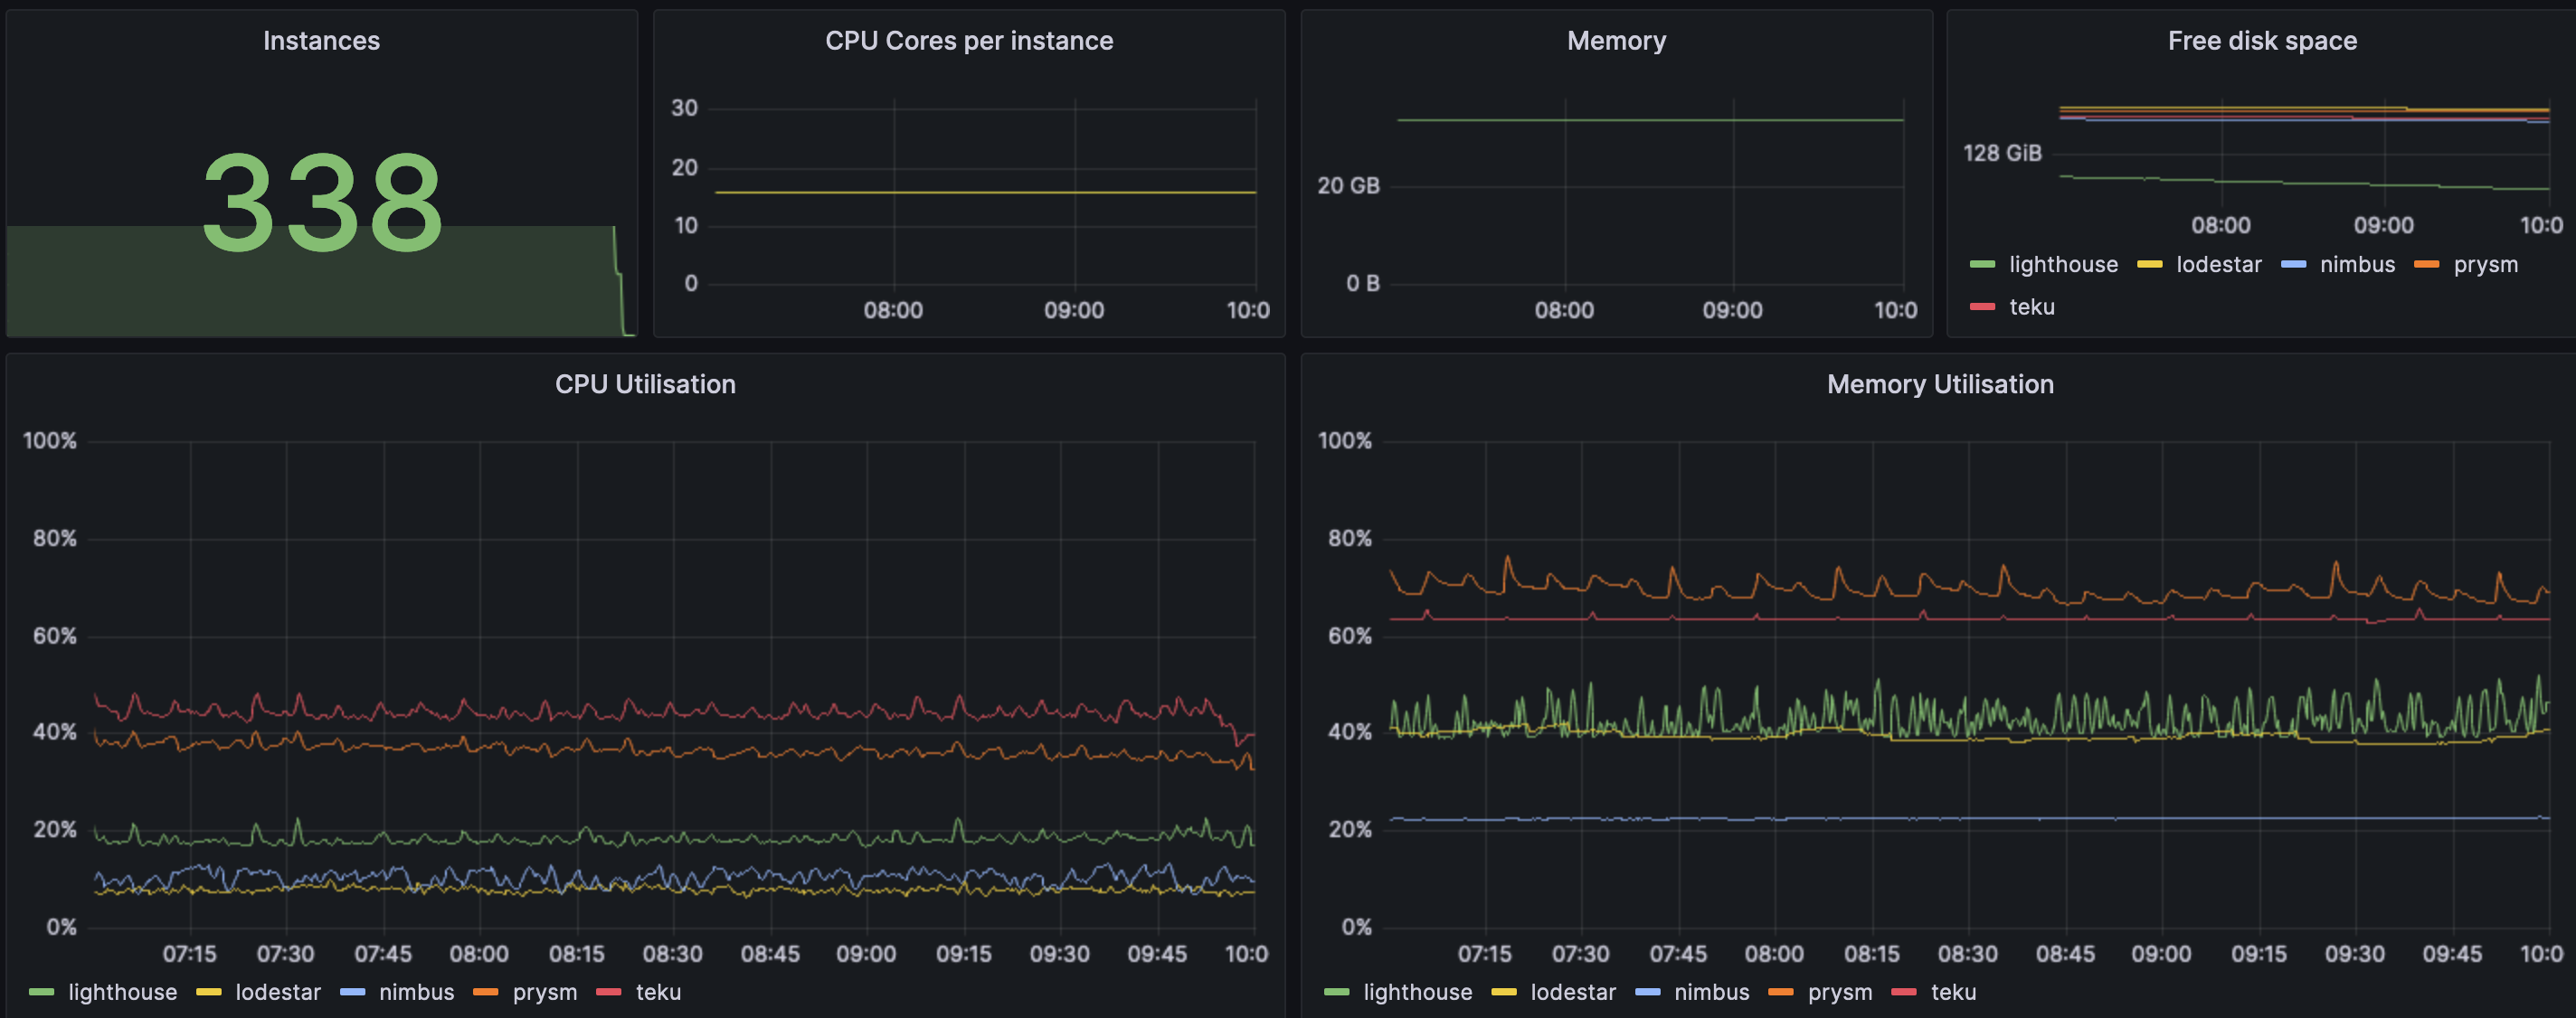
^ The above graph indicates that on average every client pair has enough resources. There are no clients that are hitting 100% use, the individual node graphs also do not indicate that any node goes above 85% usage of CPU. RAM use is far more stable and doesn't seem to increase beyond the initial increase due to non-finality periods.
- 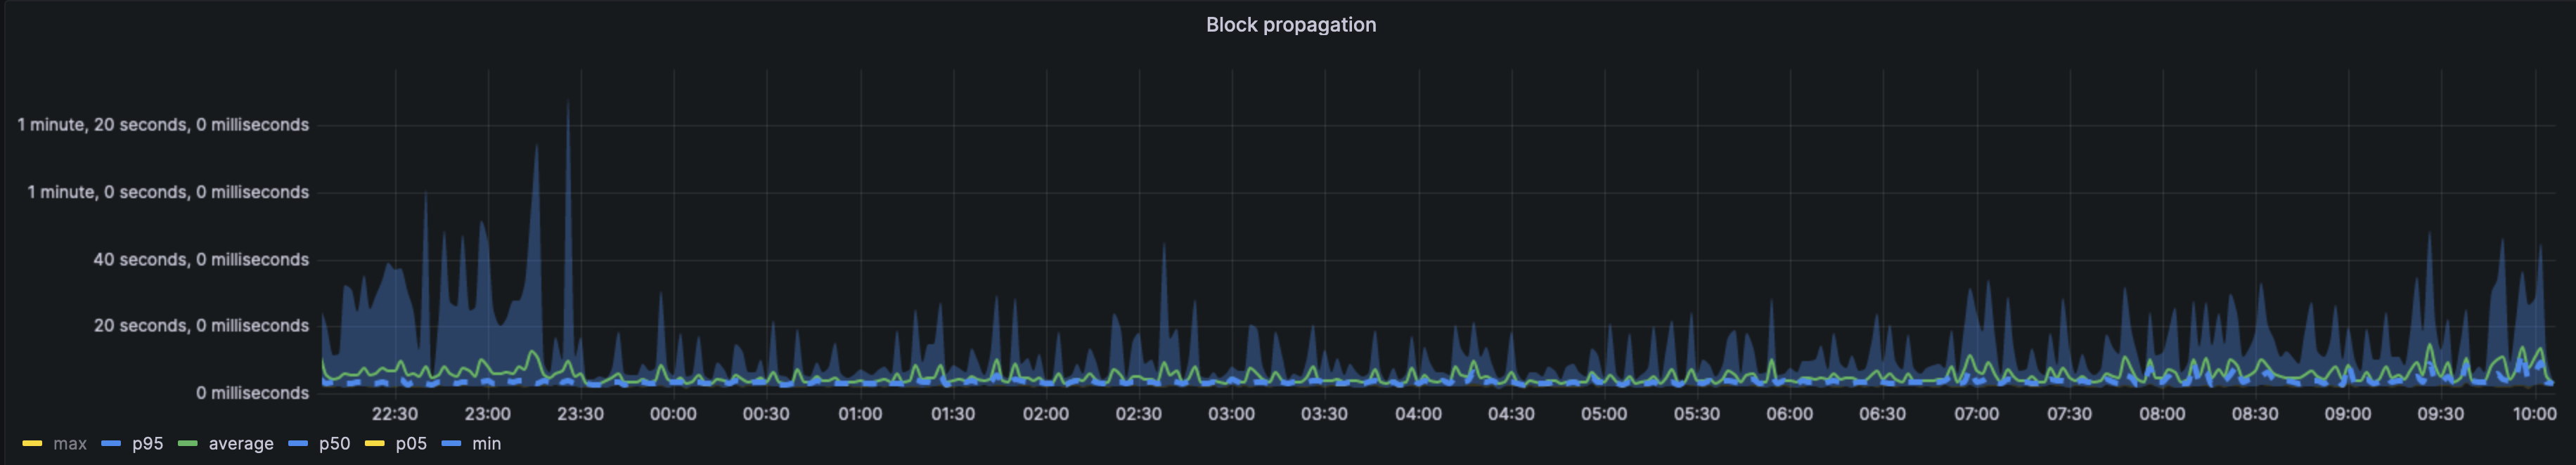
^ The above block propagation chart is far healthier than earlier tests. We rarely see the block propagation values taking too long, they are mostly propagated within the expected slot time - average being ~4s and p95 being 8-14s.
- 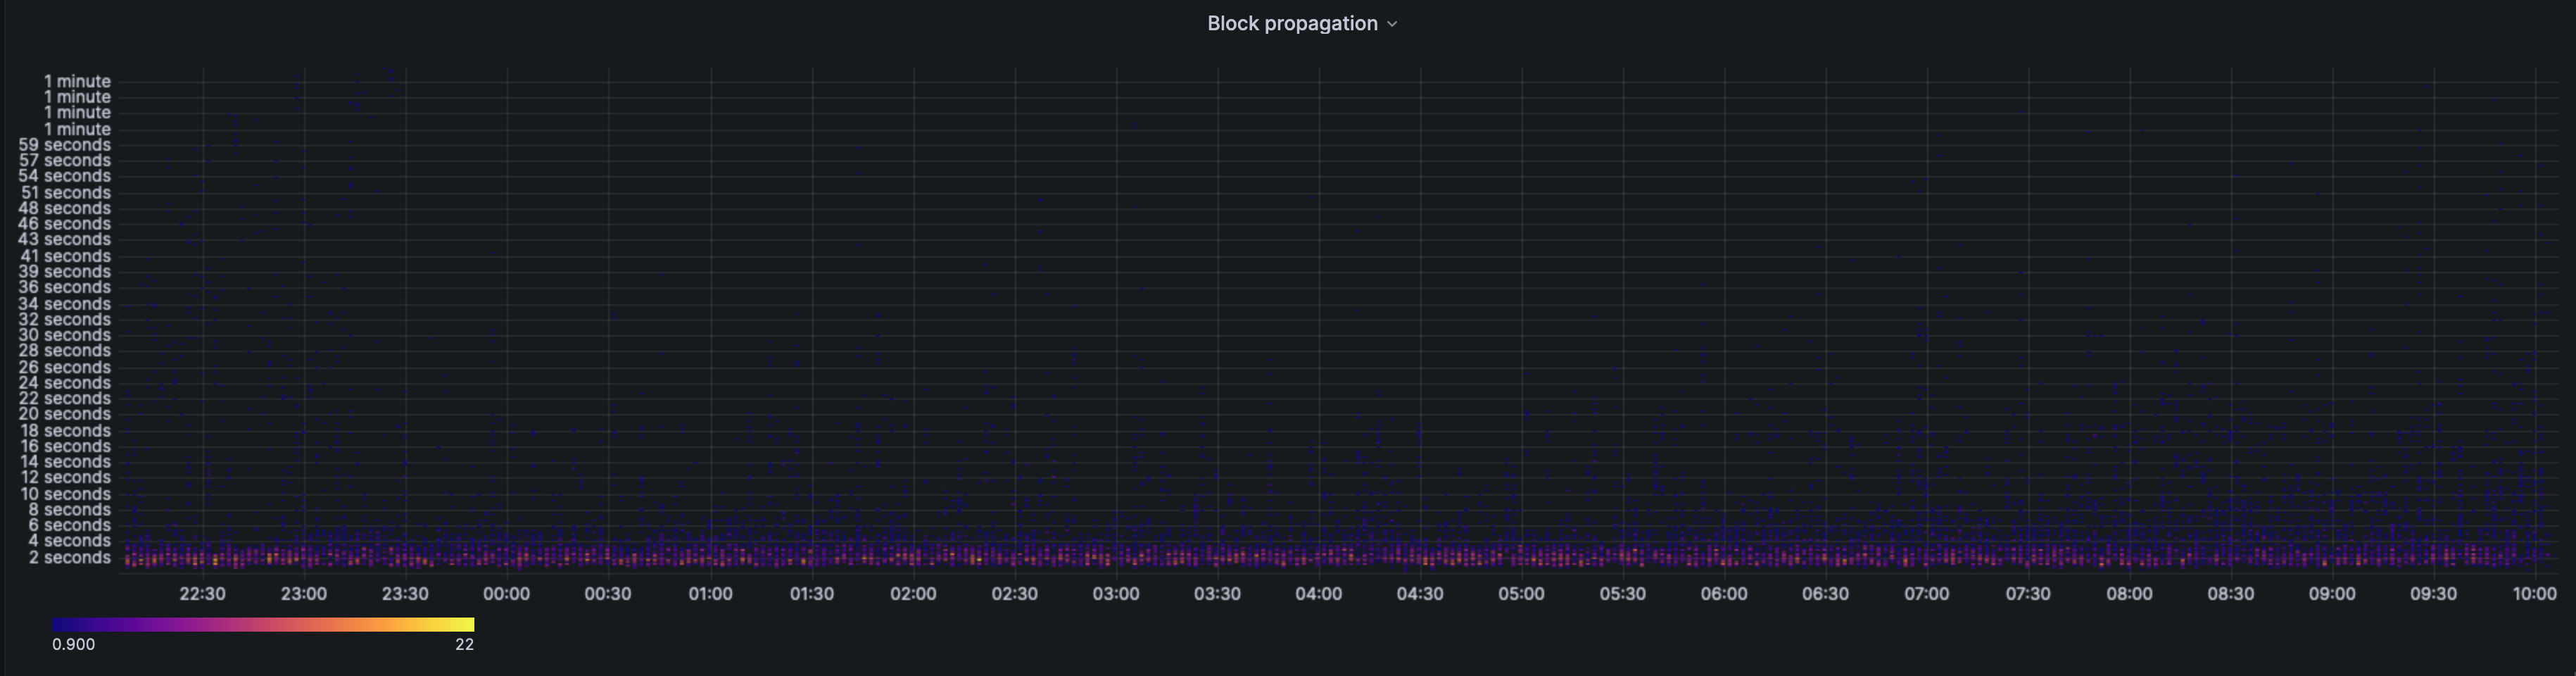
^ The heatmap reinforces the idea, most blocks are infact propagated in an expepcted band (however that band is still slightly slower than mainnet which manages the 750ms-2s range).
- 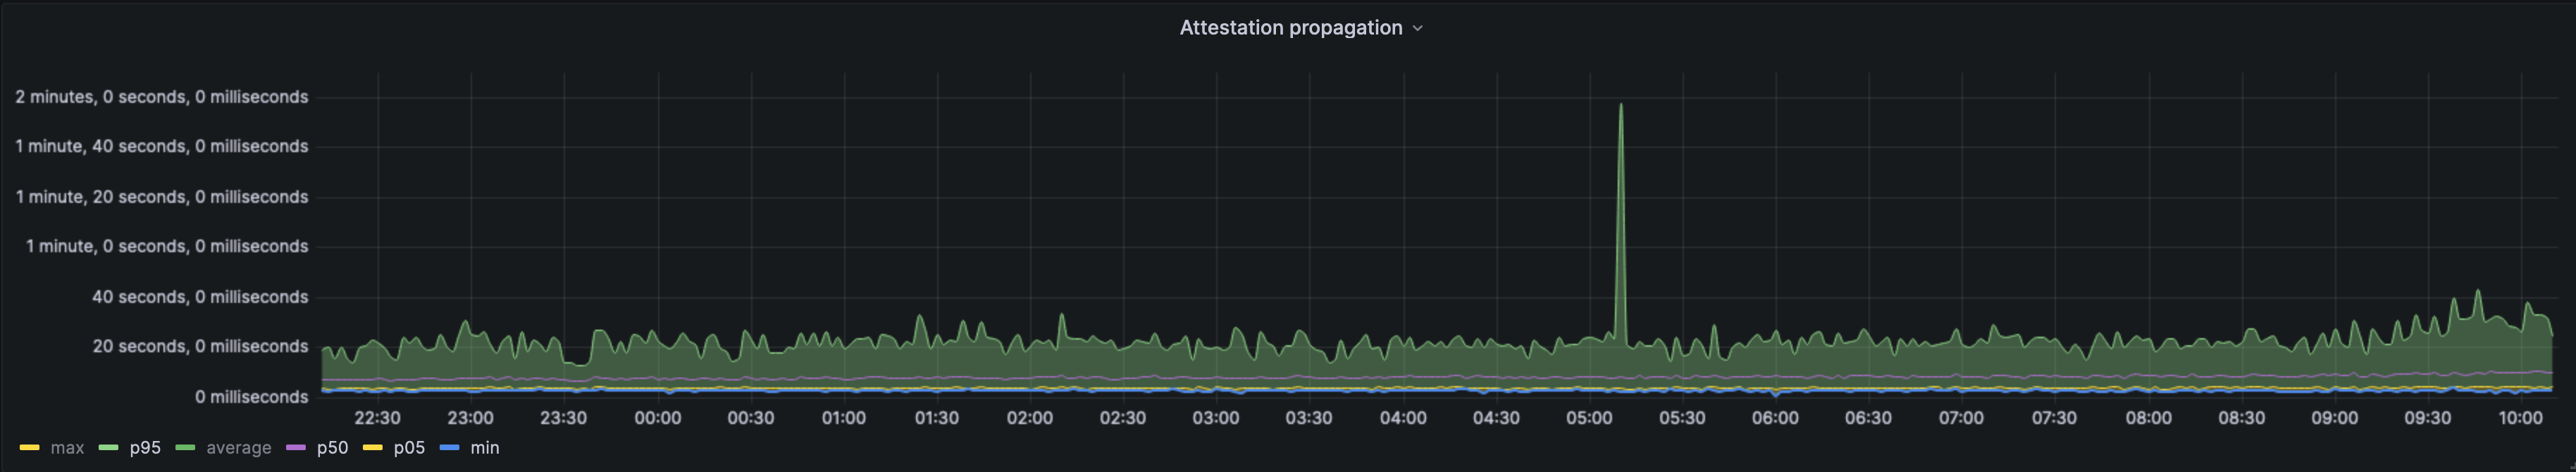
^ Attestation propagation however isn't as healthy. The p95 mark is routinely above 20s, indicating that a lot of attestations are just too late. The average value is ~8-10s.
- 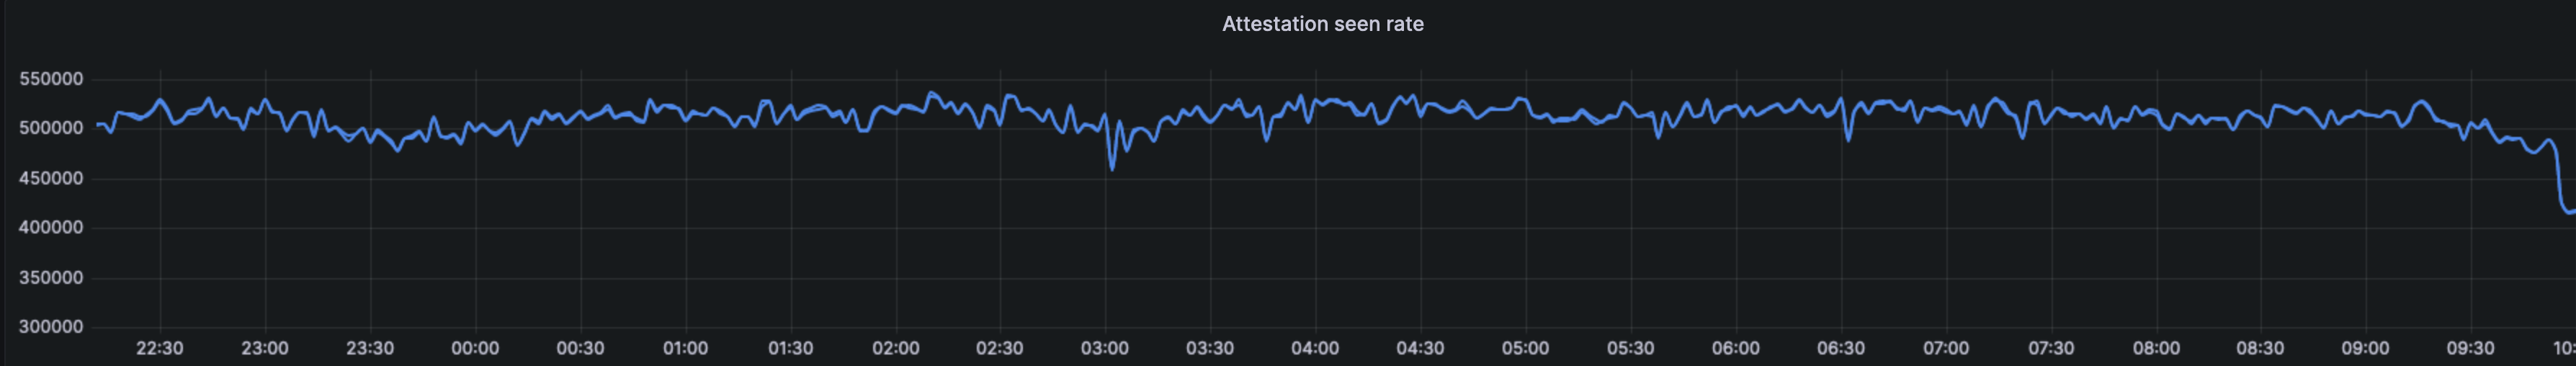
^ Xatu sees more attestations per epoch than ethdo (which is looking exclusively at what was include onchain). This graph has an interval of 2mins -> 500k * 3 = ~1.5m attestations per epoch (ethdo believes there are ~950k per epoch). The xatu query is taking a unique count of all attestation signatures seen in that time window, so bursts of attestations/delays may be slightly throwing things out by including old attestations in this metric.
**May indicate that `MAX_ATTESTATIONS` is insufficient at this scale?**
- 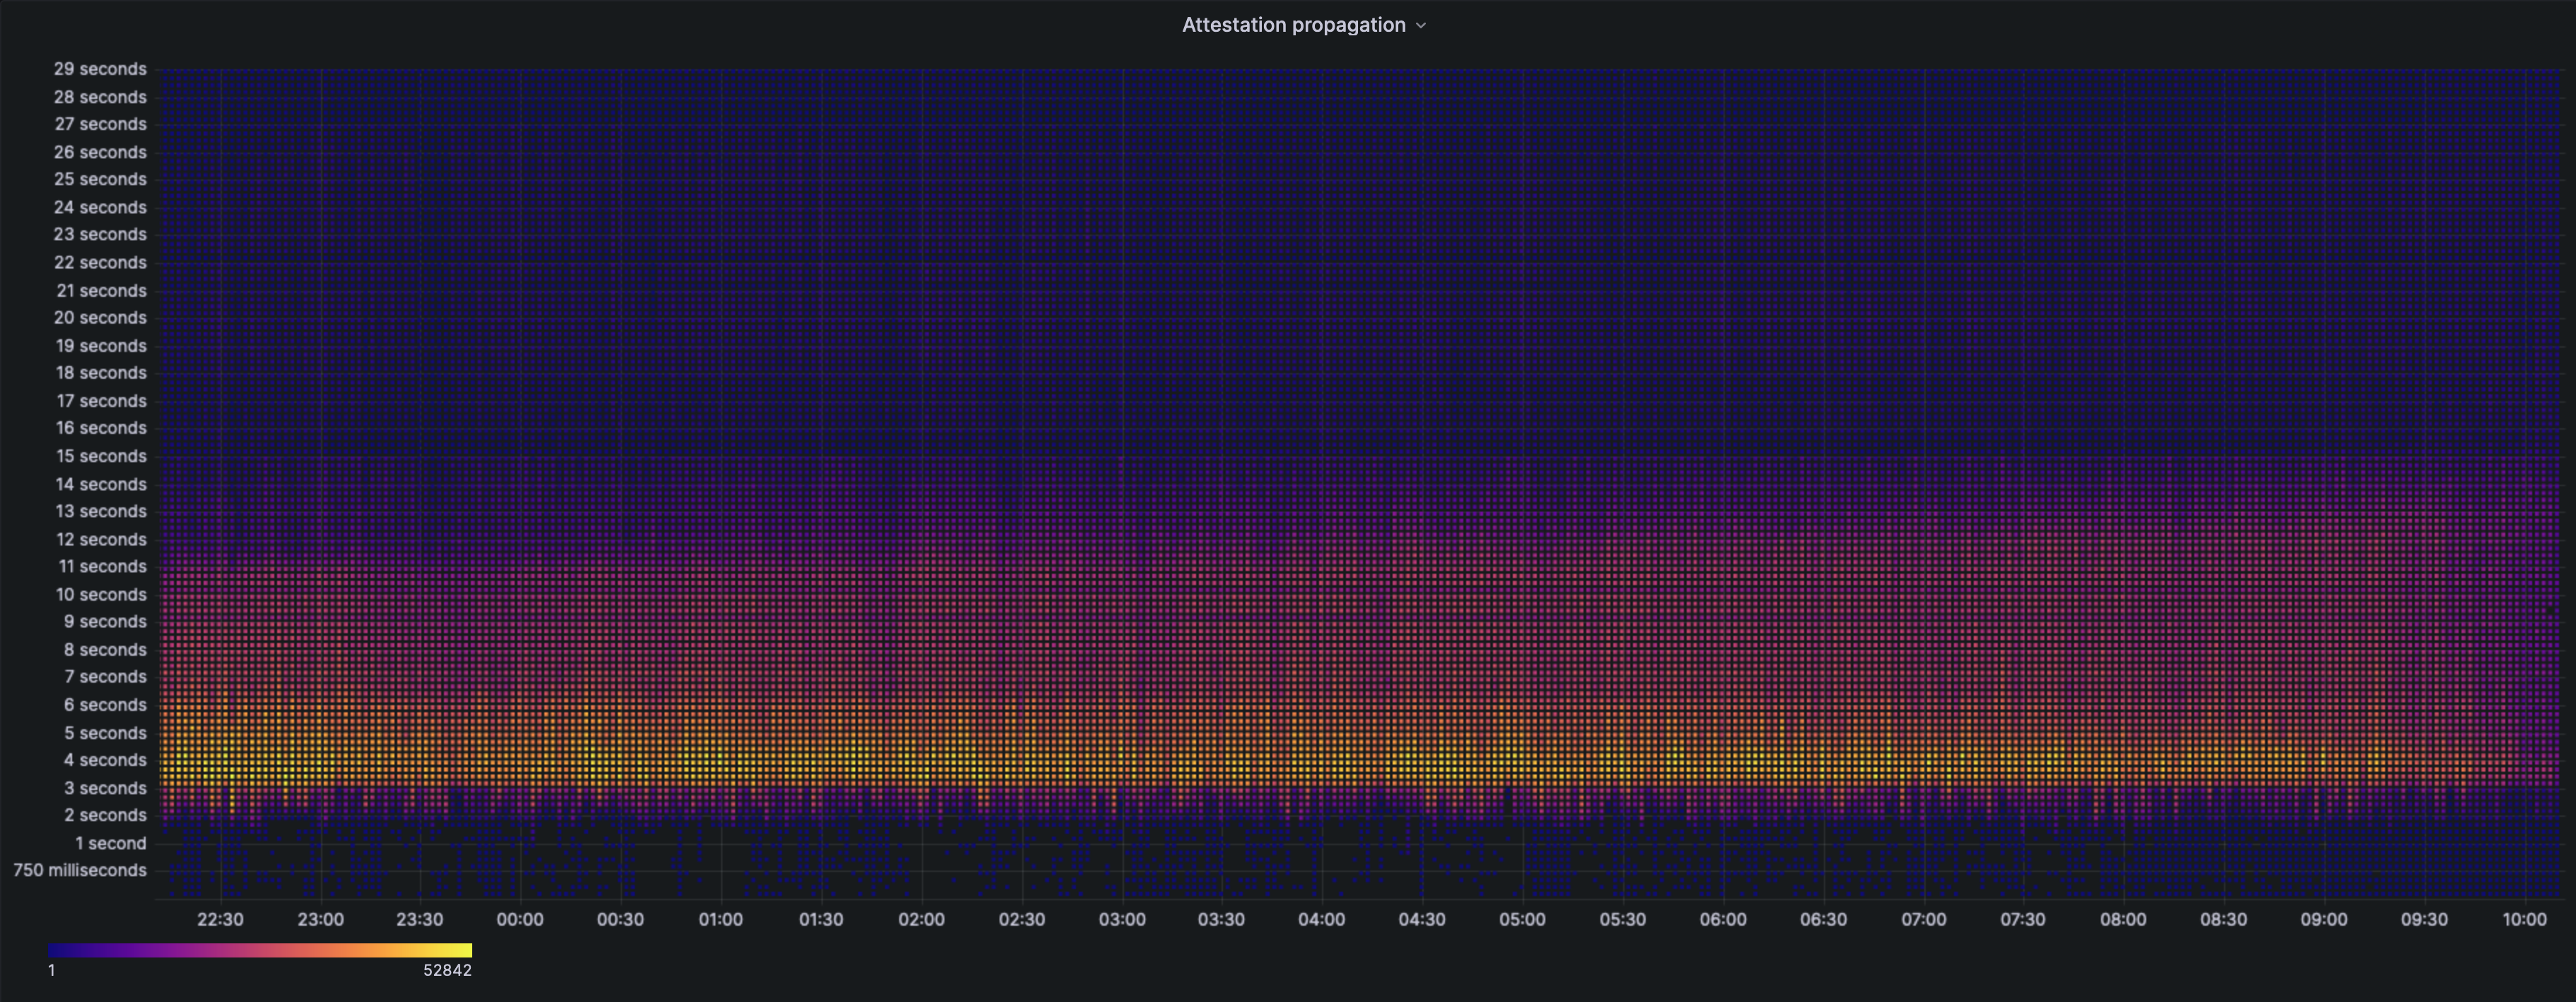
^ The attestation heatmap is far better than the previous run. We can indeed see that most attestations go out in the 4-5s mark as excpected. However, the variance is still a bit wide, we see a lot of attestations towards the end of the slot as well.
- Client specific performance for a duration (averaged by client pair) can be found here: https://grafana.observability.ethpandaops.io/d/participation_rates_dashboard/validator-participation-rates-dashboards?orgId=1&var-network=goerli&from=1691521652584&to=1691528618251
- 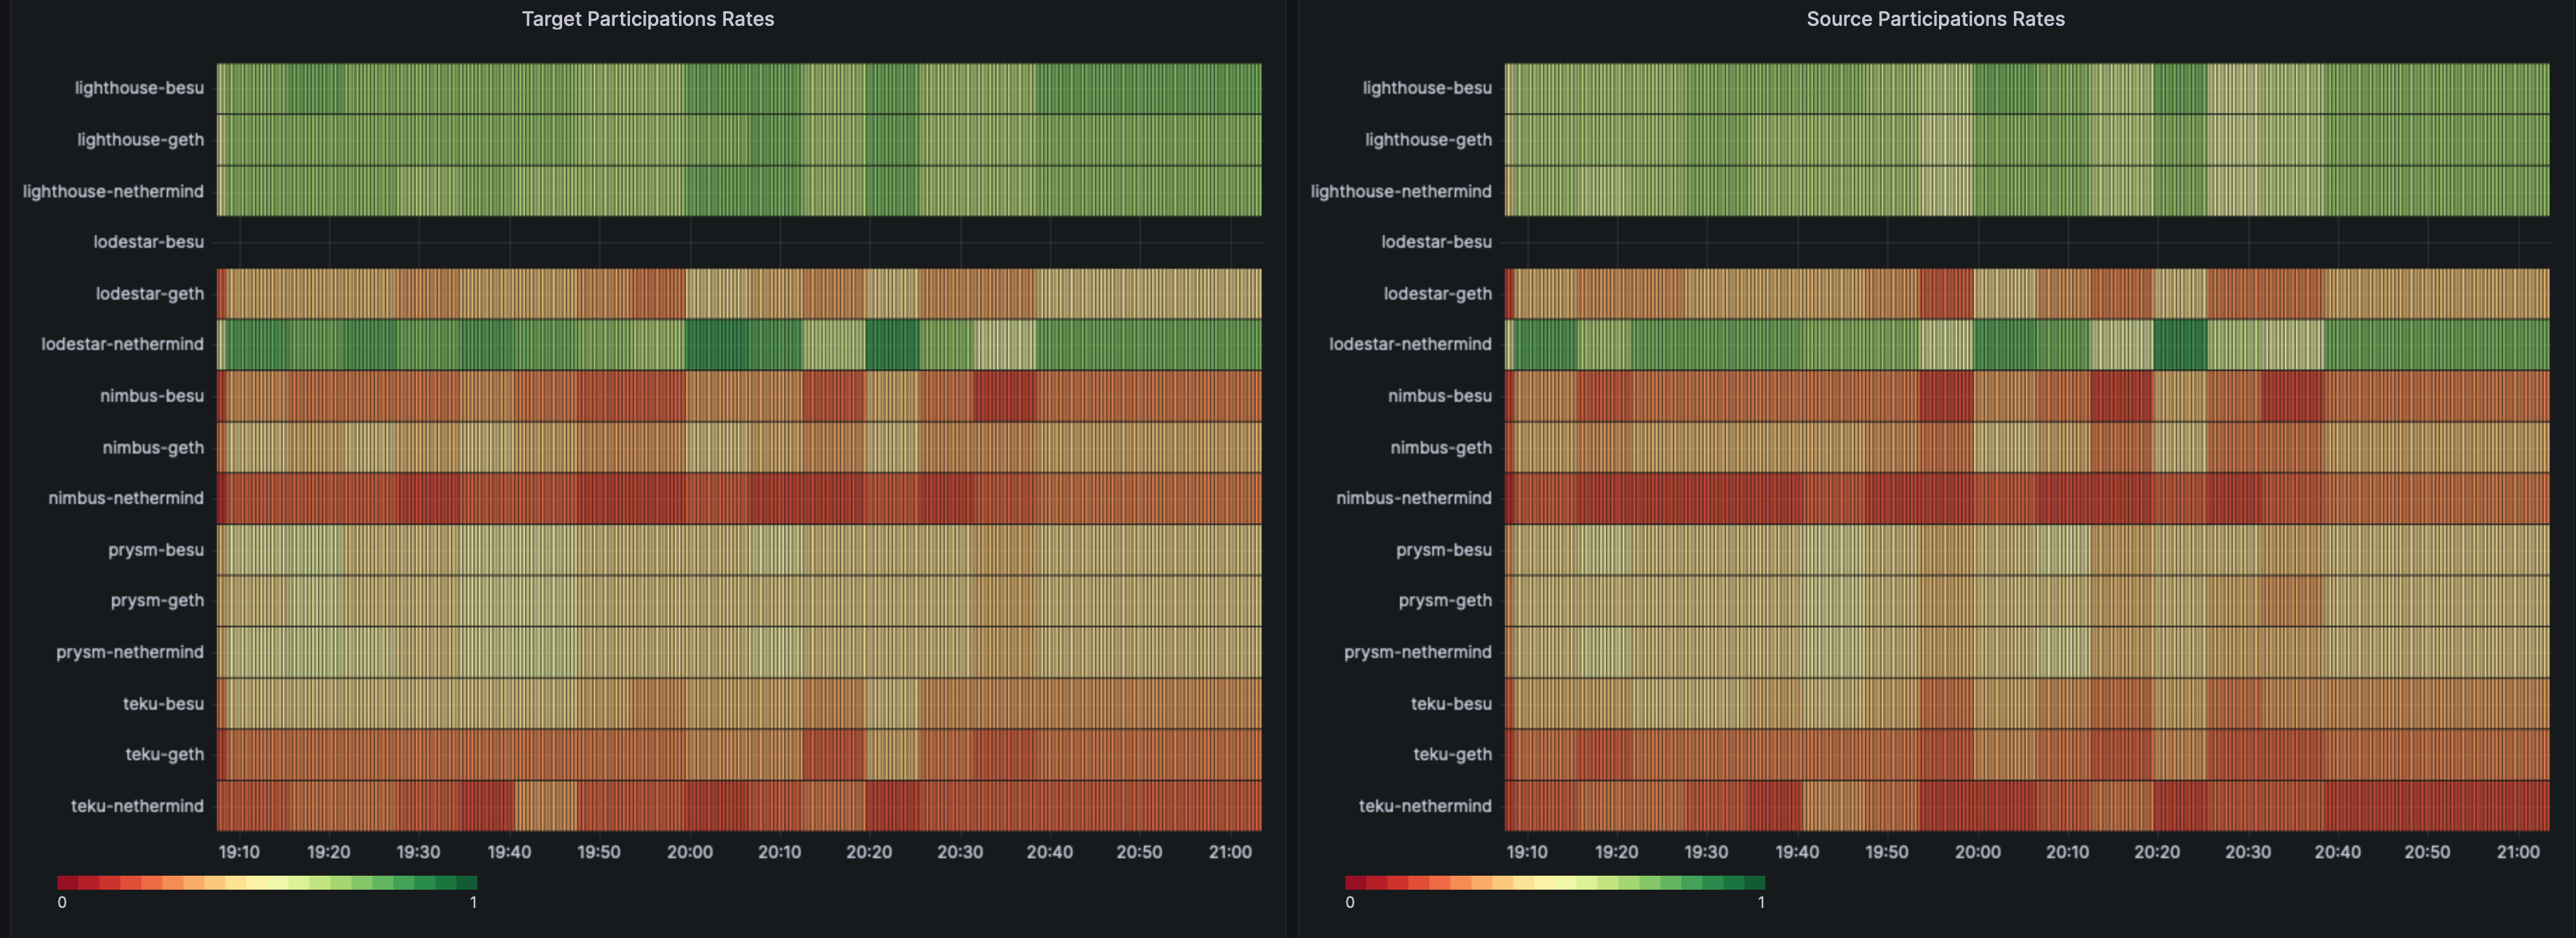
^ In the above graph (link in the previous point), we can see the averaged performance per client pair. Lodestar and Lighthouse are routinely able to hit the ~70% mark whereas Prysm is able to hit the ~45% mark. Teku and Nimbus are lower at the ~20% mark. Reach out to Dapplion to know more about how these stats are collected.
### Client Specific Reports:
- Pending, help out!
- Teku:
- Lodestar:
- Lighthouse:
- Prysm:
- Nimbus: